Figure 5.

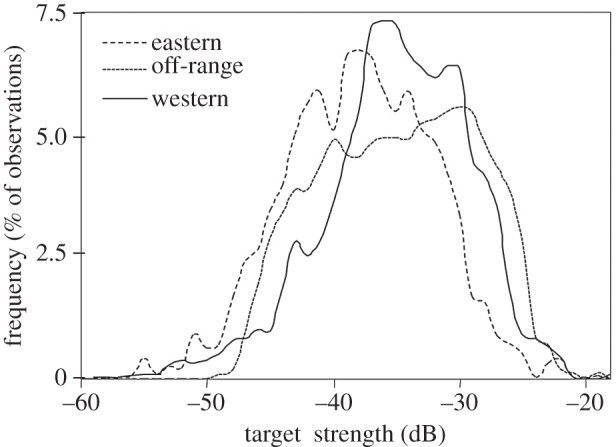
Smoothed histograms of the target strength of targets consistent with squid for each of the three habitat use categories. The y-axis is the frequency measured as the per cent of observations within each category.

Smoothed histograms of the target strength of targets consistent with squid for each of the three habitat use categories. The y-axis is the frequency measured as the per cent of observations within each category.