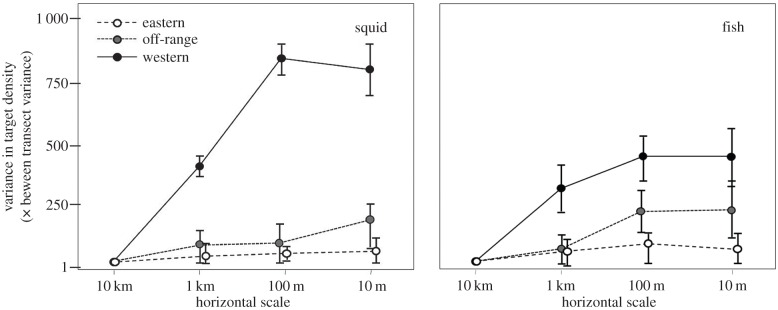
Figure 6.
To quantify the spatial distribution or patchiness of potential Ziphius prey over a range of scales, variance in the density of targets consistent with squid among segments of each transect was scaled by the between transect variance within each habitat use category as transects were split into smaller and smaller sections. Shown here are the data consistent with squid with error bars showing the variance in this measure between transects. Note that data from the eastern and off-range sampling zones are offset slightly for visual clarity however transect segments were not different in size.

