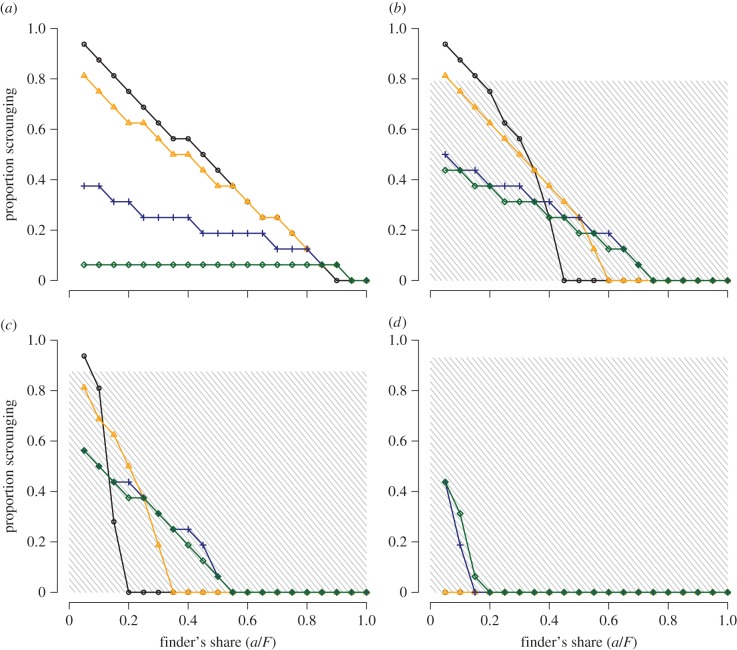
Figure 3.
The effect of the finder's share on levels of scrounging in a group depends on interactions between resource scarcity and monopolizability. Panels show data for different values of per capita resource discovery rate (λ) as follows: (a) 0.01, (b) 0.3, (c) 0.5 and (d) 0.9. Values of c as follows: 0 (black circles), 1 (orange triangles), 10 (blue crosses), 100 (green diamonds). Simultaneous resource discoveries occurred only within the shaded regions (i.e. where λqN > 1). N = 16; a/F = 0.05.

