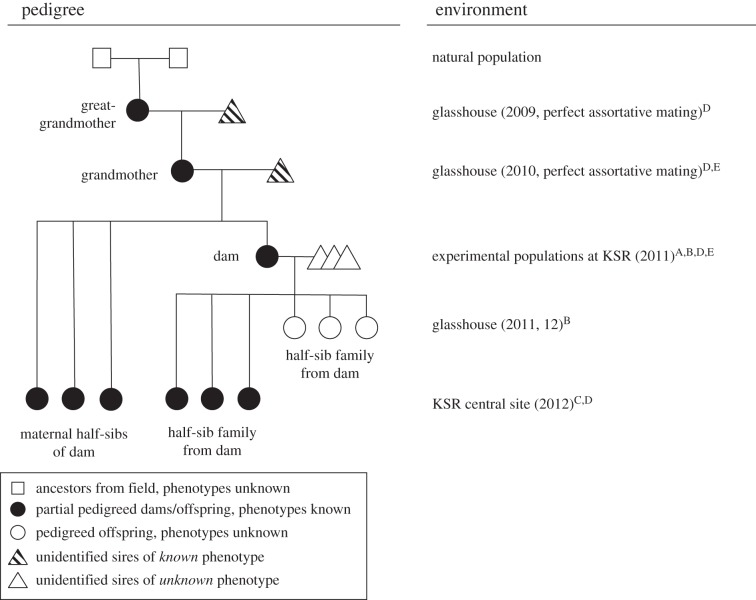
Figure 1.
Generations included in this experiment, and the environments in which they were grown. Superscripts following environment descriptors indicate the analyses in which plants were used: A = phenotypes used to estimate male fitness by mating opportunities method; B = leaf tissue used to estimate selection differential by genetic method; C = phenotypes used to estimate response to selection in experimental evolution method; D = phenotypes used to estimate heritability of age at flowering for experimental evolution method; E = sample of seeds produced used to test intergenerational maternal effects.

