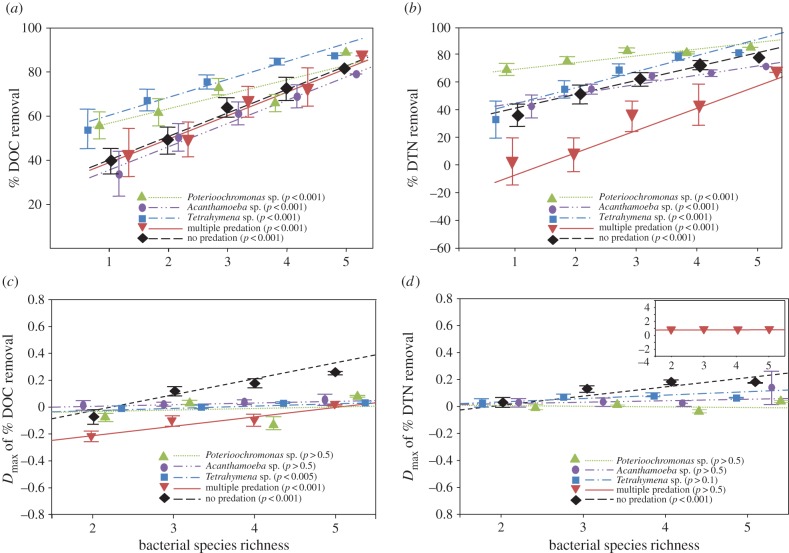
Figure 2.
Relative removal (a,b) and transgressive (Dmax) removal (c,d) of DOC and DTN as a function of bacterial species richness across all predation treatments. Each point corresponds to the average of all replicates of each bacterial species combination across all richness levels. The points referring to treatments at equal richness are slightly offset horizontally for clarity. The bar represents standard error. The significance was determined using ANOVA. (Online version in colour.)

