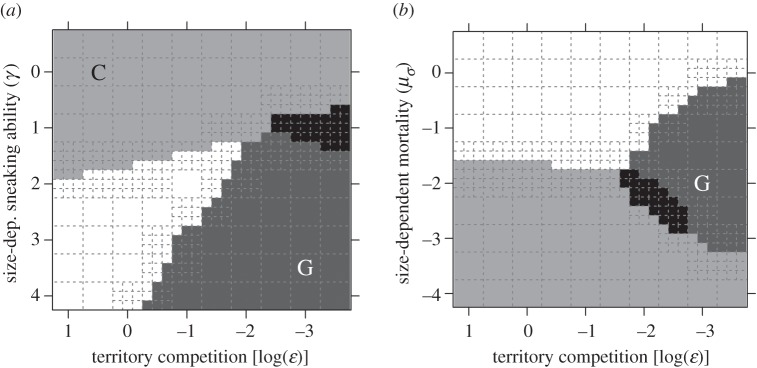
Figure 2.
Evolutionary emergence of a genetic polymorphism (G, dark grey areas), conditionally flexible tactics (C, light grey areas) and a mixture of three ARTs (black areas) in our simulations depending on varying parameter values of selection intensity on body size due to territorial competition (decreasing values reflect strong effect of body size on territory acquisition) and (a) size-dependent sneaking ability and (b) size-dependent mortality. In (a) negative values of log(γ) indicate lower sneaking ability for large individuals. In (b) negative values of log(μσ) indicate lower mortality for large individuals. The centre of each dashed-line quadrat signifies a parameter value combination that was repeated four times. Other parameter values were: r = 1, σT = 0, n = 500, α = 10−6, μi = 10−4, μ0 = 10, σp = −1,  μσ = −2(a), γ = 1.5.

