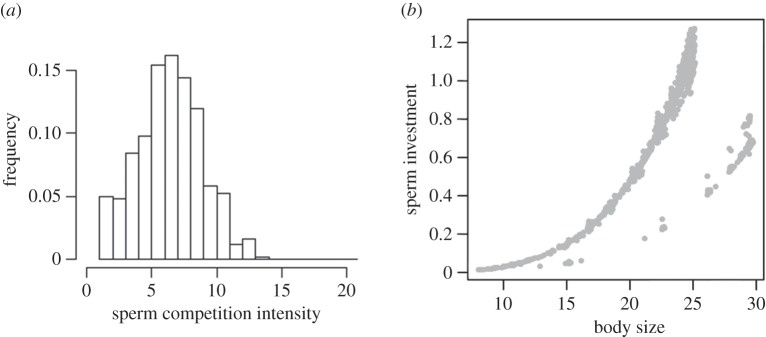
Figure 3.
Exemplary results from a simulation resulting in a genetic polymorphism with large bourgeois individuals (occurring at low frequency) and smaller parasites (occurring at high frequency. (a) The frequency distribution of the number of successful sneaking attempts in each territory (=sperm competition intensity), whereas (b) is the size-sperm investment relationship for the two morphs (represented here by dots for each individual in the population). Parameter values: r = 1, σT = 0, n = 500, α = 10−6, μi = 10−4, μ0 = 10, σp = −1, μσ = −2, γ = 1.5, ɛ = 10−3.

