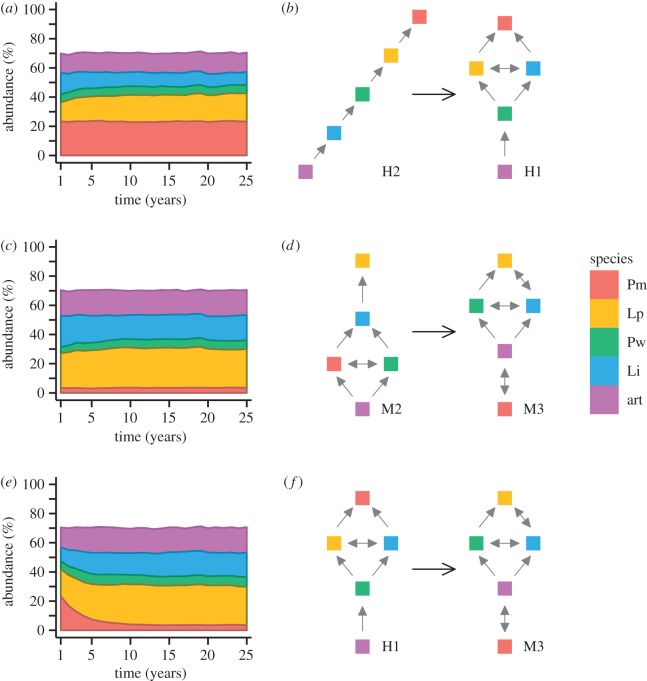
Figure 1.
Effect of changing competition rules on mature simulated communities. (a) Stacked line plot of species abundance when adding grazers to the historical community (Scenario H2 community with H1 rules); (c) stacked line plot of species abundance adding grazers to the modern community (Scenario M2 community with M3 rules; and (e) stacked line plot of species abundance when adding ocean acidification stress to the historical community (Scenario H1 community with M3 rules). Panels (b,d,f) show corresponding changes in the interaction networks as determined by Paine [24] and McCoy & Pfister [33]. Grey arrows point to winners among species pairs, determined by an observed winning frequency more than 0.6. Double-headed arrows indicate a pairwise winning frequency between 0.4 and 0.6. All scenarios are shown under 30% external colonization probabilities. Different species are shown by colour: Pm, Pseudolithophyllum muricatum; Lp, Lithothamnion phymatodeum; Pw, Pseudolithophyllum whidbeyense; Li, Lithophyllum impressum; art, articulated spp.

