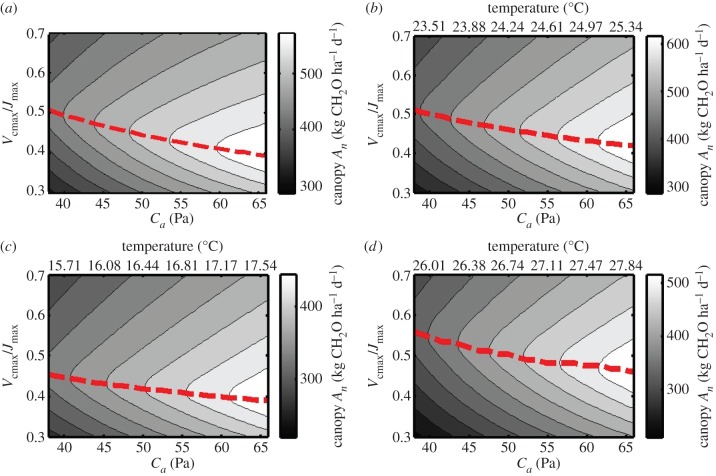
Figure 4.
Canopy diurnal photosynthetic carbohydrate production as a function of atmospheric CO2 partial pressure (Ca) and varying Vcmax/Jmax at a constant temperature of 25°C (a) or covariation of temperature as a function of Ca (b–d). Computations were performed for three geographical locations: (a,b) Midwest USA (42.5° N, 92.5° W), (c) UK (52° N, 0° E) and (d) Uganda (0.3° N, 32.6° E) for simulated light and temperature conditions on 31 July. Temperature was covaried with Ca according to a linear regression (r2 = 0.992) between predicted future [CO2] increases and temperature anomalies derived from IPCC predictions (2013). For further details, see the electronic supplementary material.

