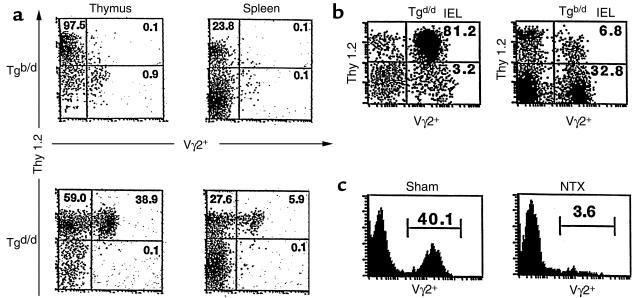
Figure 1.
(a) Flow cytometry (FCM) 2-color analysis of thymus and spleen from Tgb/d (top row) and Tgd/d (bottom row) mice. (b) FCM analysis of IEL from Tgd/d (left) and Tgb/d (right) mice. (c) FCM histogram analysis of IEL from 6-week-old Tgb/d mice that were sham operated (left) and thymectomized (NTX; right) on day 2 of life. Data shown represent 1 of 2 independent experiments.

