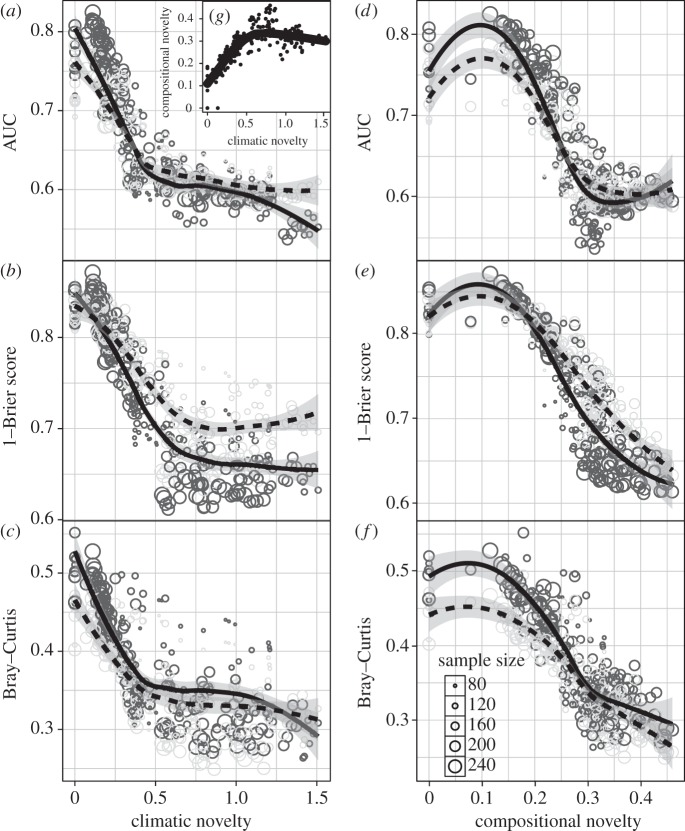
Figure 2.
Model performance as a function of climatic and compositional novelty. AUC scores (a,d), 1−Brier scores (b,e) and Bray–Curtis similarity (1 – Bray–Curtis dissimilarity) (c,f) as a function of climatic novelty (a–c) and compositional novelty (d–f), fitted with a local polynomial regression (LOESS) line. Black circles and solid black lines represent SDM values. Grey circles and dashed lines represent CLM values. Circle size reflects sample size. (g) (inset in (a)) Compositional novelty as a function of climatic novelty.

