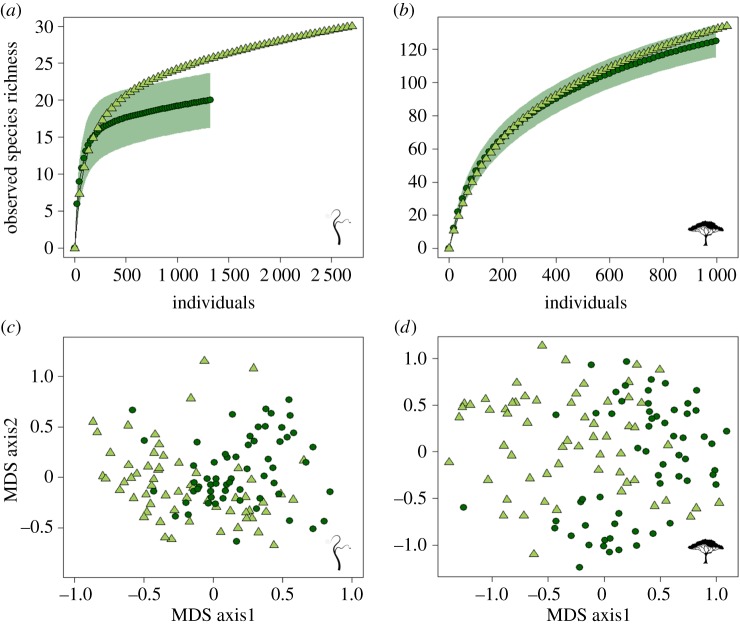
Figure 2.
Logging impacts on species richness and composition. (a,b) Observed species richness, constructed using incidence-based rarefaction curves for the two forest types, of (a) lianas and (b) trees. The x-axis is scaled to show the number of individuals; note that scales differ between figures. (c,d) Multi-dimensional scaling (MDS) plots showing the ordination of transects surveyed in relation to their community composition for (c) lianas and (d) trees. Dark green circles, primary forest; light green triangles, logged forest; green polygons, 95% CI for primary forest. (Online version in colour.)

