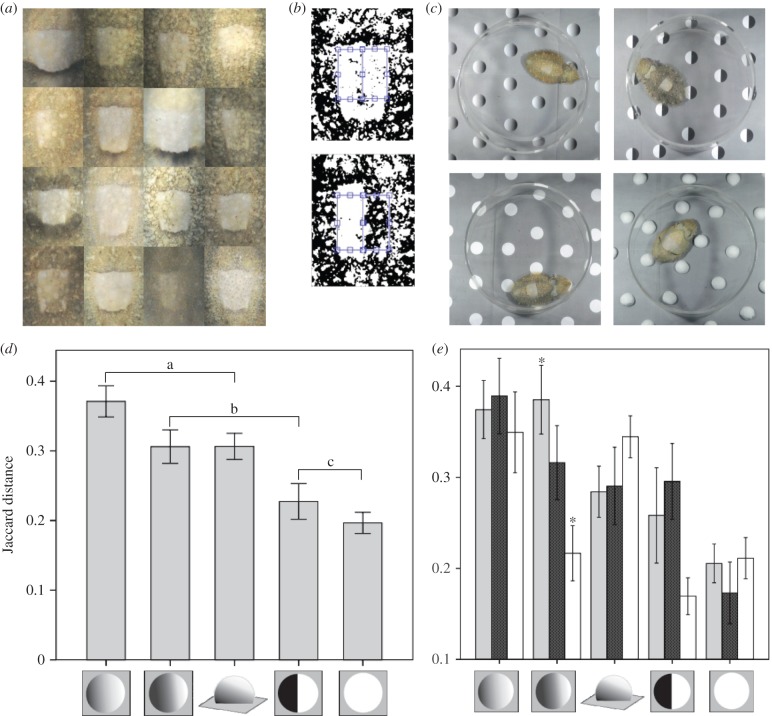
Figure 3.
(a) Some of the range of observed WS shading responses across all treatments. (b) Two examples of thresholded WS regions with little shading (top) and heavily asymmetrical shading (bottom), with blue rectangles showing areas compared. (c) Examples of typical responses to four of the test stimuli (note the dark posterior mantle bar on the animal with real hemispheres). (d) Mean difference in WS shading between halves as determined by JD for the stimuli shown. Brackets show homogeneous subgroups determined by Tukey's HSD post hoc tests following univariate analysis of variance. Error bars show standard error. (e) Mean difference in WS shading between halves as determined by JD for the stimuli showing the effects of different illumination conditions. Light grey bars: direction of illumination congruent with shading where appropriate; stippled bars: direction of illumination incongruent with shading cues where appropriate; white bars: illumination from both directions. Asterisks indicate significant difference between conditions determined by Tukey's post hoc pairwise comparisons. Error bars show 1 standard error. (Online version in colour.)

