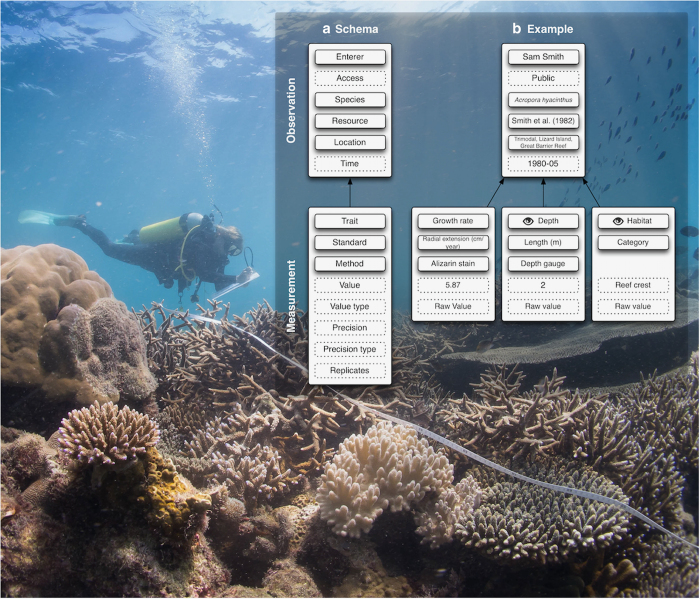
Figure 1. Overview of the design of the Coral Trait Database.
(a) The general schema consists of an Observation of a coral colony that is a collection of one or more Measurements associated with the colony. Solid borders represent table associations and dotted borders represent values. Observations have four table associations (contributor, coral species, resource and location) and one value for access (i.e., public or private). Measurements have four table associations (observation, trait, methodology and standard) and five values. (b) An example of an observation where coral growth rate was measured along with two contextual measurements (represented in the database by an eye). All observation-level attributes are required. Required measurement-level attributes are trait, standard, value and value type. Precision details are entered when a value type is not a raw value. Photograph: Emily Darling.

