
Figure 2.
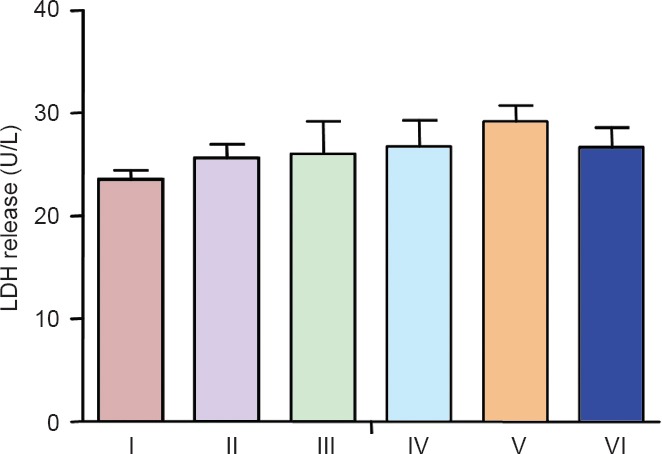
LDH release in cultured neurons treated with different concentrations of (Val8)GLP-1-Glu-PAL.
Data are expressed as the mean ± SEM. All experiments were performed independently in triplicate. Groups were compared by one-way analysis of variance and Dunnett's t-test. There was no significant difference in LDH release among groups. LDH: Lactate dehydrogenase; GLP-1: glucagon-like peptide-1; I: control group; II: Val8-PAl (10 nM) group; III: Val8-PAl (50 nm) group; IV: Val8-PAl (100 nM) group; V: Val8-PAl (200 nm) group; VI: Val8-PAl (500 nM) group.