
Figure 1.
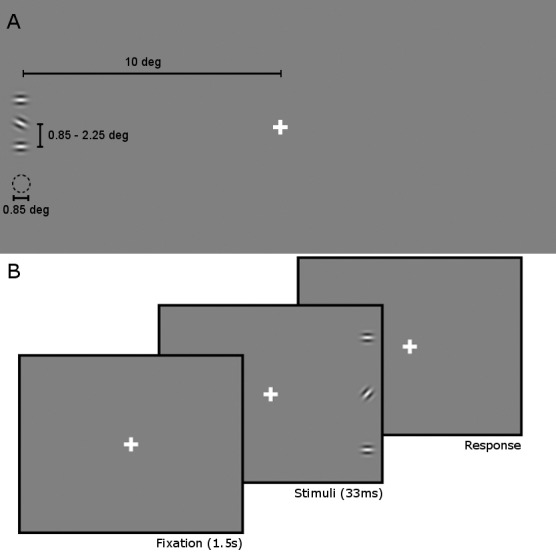
Display layout (A) and trial time course (B). Images not to scale. (A) The target was presented 10° of visual angle from the fixation cross. It was flanked by two identical, horizontal Gabor patches. To measure the spatial range of the crowding effect, target–flanker distance varied on each trial (0.85–2.25°). Only the closest target–flanker distance (0.85°) is shown. (B) Stimulus presentation lasted 33 ms, and was preceded by 1.5 s of fixation time (the intertrial interval). Response time was left to the participant, but could last a maximum of 5 s, after which the trial was counted as an error.