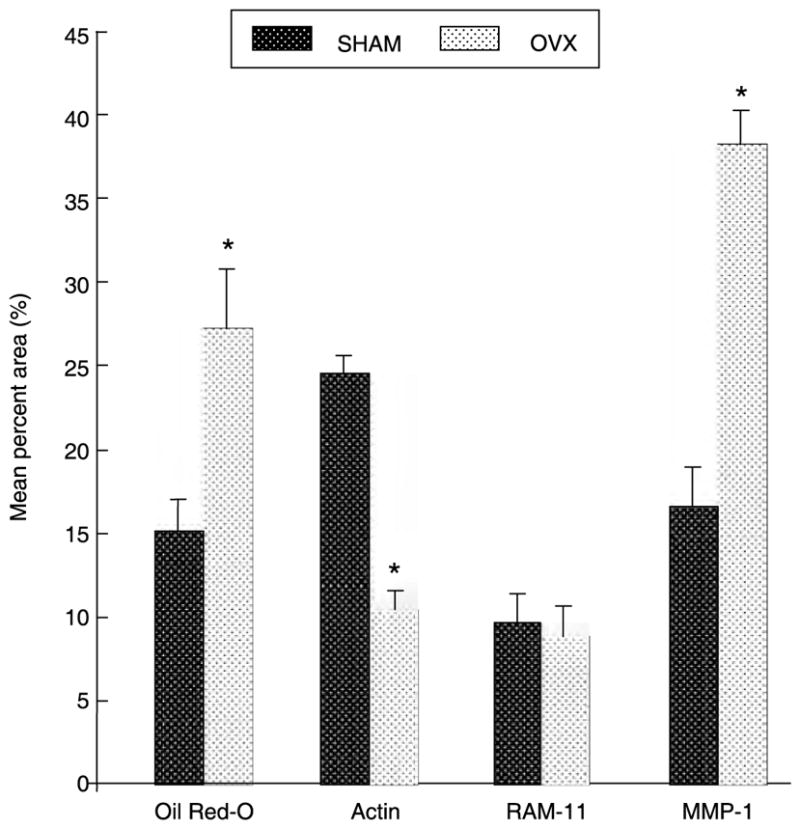
Figure 2.

Histopathological analysis of aortic vessel wall composition. Oil Red O positive area corresponds to lipid deposition, α-actin to smooth muscle, and RAM-11 to macrophage content. *P < 0·05 vs. SHAM. All values expressed as mean percent area ± SEM for each treatment group. OVX: ovariectomized group (n = 12); SHAM: sham-operated control group (n = 12).
