
Figure 3.
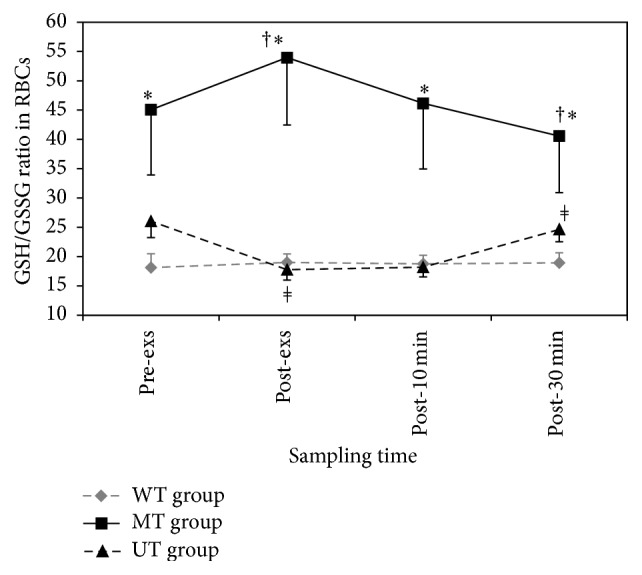
Effects of one session of aerobic exercise on GSH/GSSG ratio in red blood cell (RBC) in subjects with different physical training status: values represent mean ± SEM (n = 10) for each time point. ∗ (F = 4.176, p = 0.026) MT group versus WT and UT groups in pre- and post-exs (F = 9.202, p = 0.001), post-10 min (F = 5.890, p = 0.008), and post-30 min (F = 3.737, p = 0.037); † MT group by time (p < 0.001); ǂ UT group by time (p = 0.006).