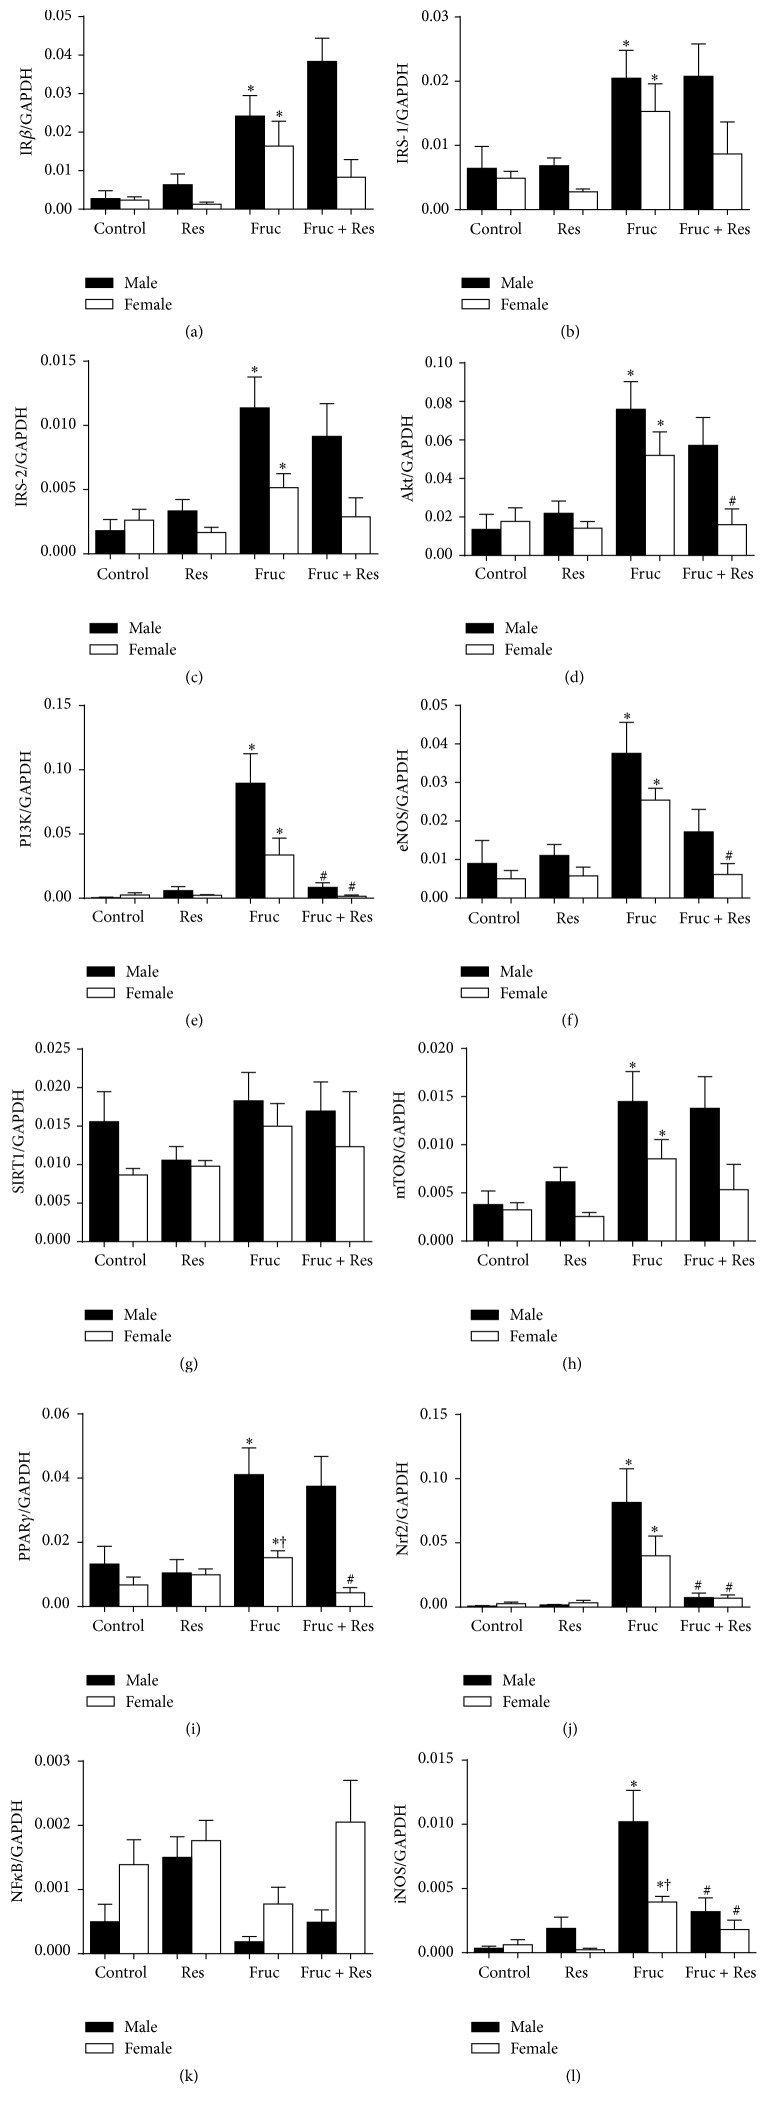
Figure 1.
The mRNA expression levels of IRβ (a), IRS-1 (b), IRS-2 (c), Akt (d), PI3K (e), eNOS (f), SIRT1 (g), mTOR (h), PPARγ (i), Nrf2 (j), NFκB (k), and iNOS (l) in the adipose tissues of male and female rats from the control, resveratrol (Res), fructose (Fruc), and Res + Fruc groups. Data was normalized by GAPDH. Each bar represents the means of at least six rats. Values are expressed as mean ± SEM, n = 6–12. ∗Significantly different (P < 0.05) compared to control group; #significantly different (P < 0.05) compared to fructose group; †significantly different (P < 0.05) compared to male group.

