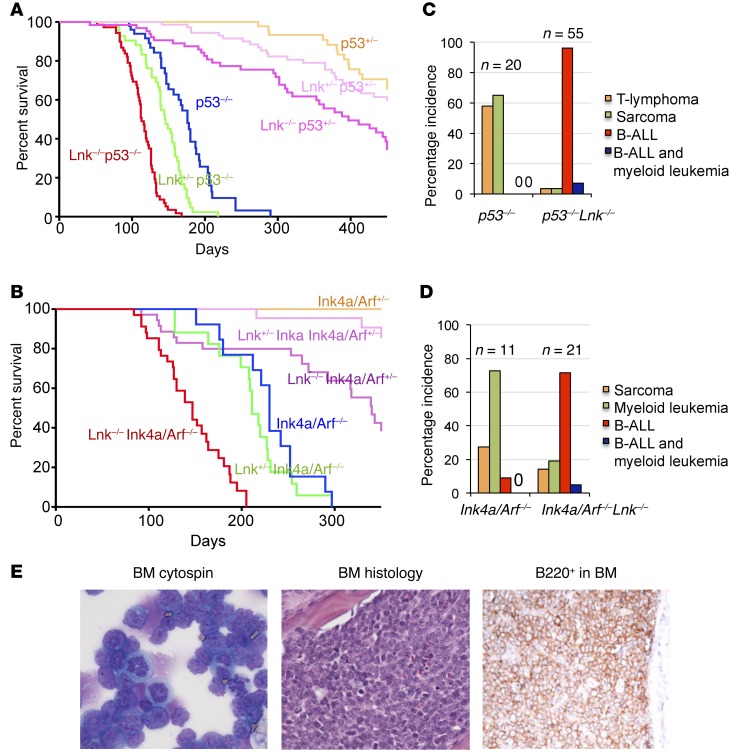
Figure 1. Lnk deficiency synergizes with loss of tumor suppressors TP53 and INK4A/ARF to promote B-ALL.
(A and B) Kaplan-Meier curves show the survival of p53/Lnk (n = 42–74 mice per group) (A) or Ink4aArf/Lnk (n = 12–40 mice per group) (B) mutant mice. Log-rank t tests are shown in Supplemental Tables 1 and 2. (C and D) The bar graphs depict the tumor incidences of p53/Lnk (C) or Ink4aArf/Lnk (D) mutant mice. n numbers are labeled on top of the bars. (E) Histology of p53–/–Lnk–/– B-ALLs are shown as Wright-Giemsa staining of BM cytospins (left, ×600 magnification), H&E staining of BM sections (middle, ×200), and IHC with anti-B220 antibodies (right, ×100).

