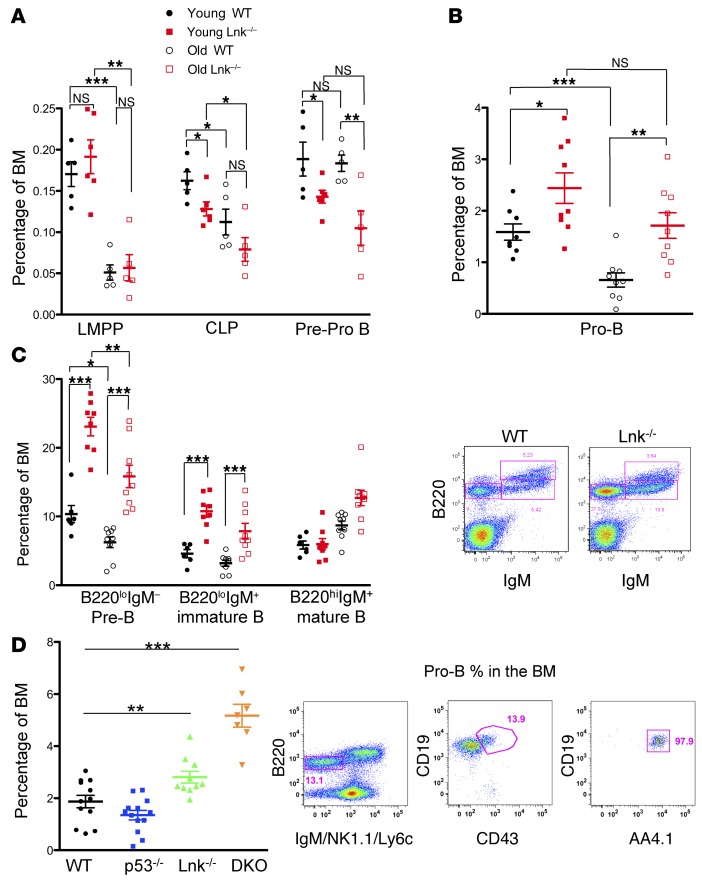
Figure 5. LNK regulates pro-B homeostasis and aging.
(A and B) Young and old Lnk–/– mice show increased pro-B cells in the BM. Percentages of various lymphoid progenitors in young and old mice are shown. The following markers are used: LMPP, Lin–Kit+Sca1+Flt3hi; CLP, Lin–IL-7R+Flt3+Sca1loKitlo; pre-pro B, Lin–Ly6C–NK1.1–IgM–AA4.1+CD19–B220+; pro-B, B220+CD43+AA4.1+CD19+. *P < 0.05; **P < 0.01; ***P < 0.0001; ns, not significant, 2-tailed Student’s t test. n = 8–9 mice per group. (C) Young and old Lnk–/– mice show increased numbers of pre-B cells and immature B cells in the BM. Representative flow plots are shown. *P < 0.05; **P < 0.01; ***P < 0.001; ns, not significant, 2-tailed Student’s t test. n = 7–9 mice per group. (D) Young p53–/–Lnk –/– mice show increased pro-B% in the BM. Pro-B cells were determined by a stringent panel of markers B220+IgM–Nk1.1–Ly6C–CD43+AA4.1+CD19+, as shown by representative flow plots. n = 7–12 mice per group.

