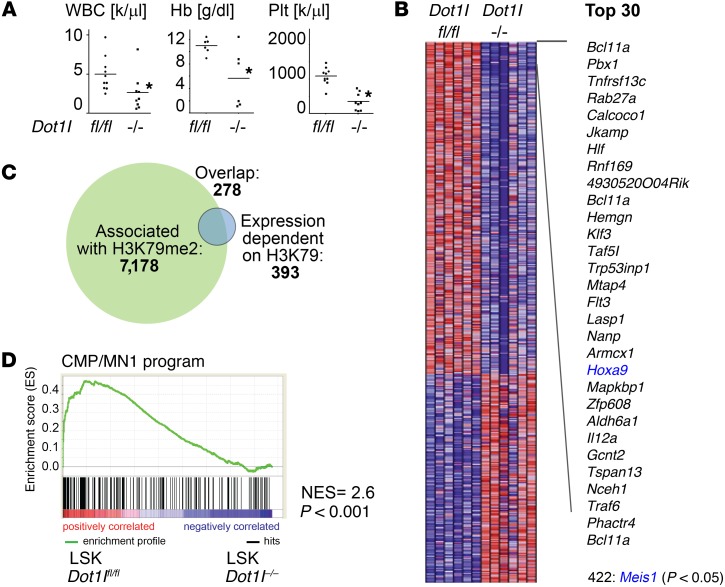
Figure 1. The MN1 cooperating program is enriched in Dot1l WT versus KO LSK cells.
(A) Total WBC, hemoglobin (Hb), and platelet (Plt) count in Dot1lfl/fl (fl/fl, n = 10) and Mx1-Cre Dot1lfl/fl (–/–, n = 9) mice 3 weeks after the induction of Cre. Two-sided t test Dot1l–/– vs. Dot1lfl/fl; *P < 0.05. (B) Heatmap of expression array data of sorted LSK cells from Dot1lfl/fl (fl/fl) and Mx1-Cre Dot1lfl/fl (–/–) mice 12 days after induction of Cre. Shown are all probe sets/genes with differential expression at P < 0.05 (393 genes), as well as a list of the top 30 differentially expressed probe sets and Meis1; n = 6 mice per group. (C) Venn diagram of genes associated with H3K79 dimethylation in LSK cells by ChIP-Seq (18) and genes downregulated after loss of Dot1l in LSK cells. (D) GSEA showing enrichment of the CMP/MN1 program in Dot1lfl/fl vs. Dot1l–/– LSK cells. NES and P value according to ref. 43.

