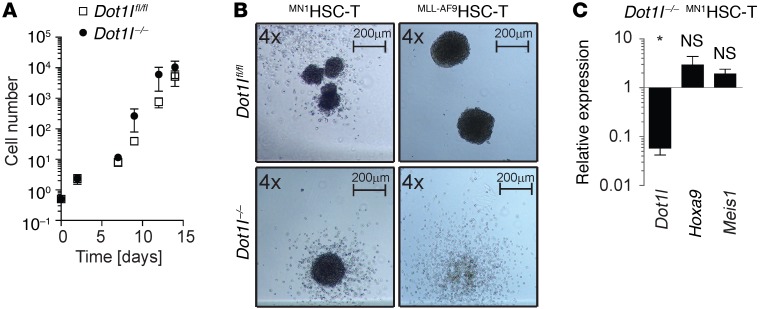
Figure 5. MN1HSC-T grow independently of DOT1L in vitro but not in vivo.
(A) Serial cell counts of Dot1lfl/fl and Dot1l–/– MN1HSC-T. n = 5 individual experiments (3LT-HSC, 2 SLAM). Two-sided t test Dot1l–/– vs. Dot1lfl/fl. There were no statistically significant differences between Dot1lfl/fl and Dot1l–/– MN1HSC-T (or LT-HSC– and SLAM-derived MN1HSC-T, data not shown). (B) Methylcellulose colony morphology of MN1- or MLL-AF9–transformed LT-HSCs 9 days after transduction with Cre. (C) qPCR for Dot1l, Hoxa9, and Meis1 in MN1HSC-T. Each bar represents fold-change in Dot1l–/– compared with Dot1lfl/fl (set to 1). n = 4. Error bars represent ±SEM; *P < 0.01 (two-sided t test Dot1l–/– vs. Dot1lfl/fl).

