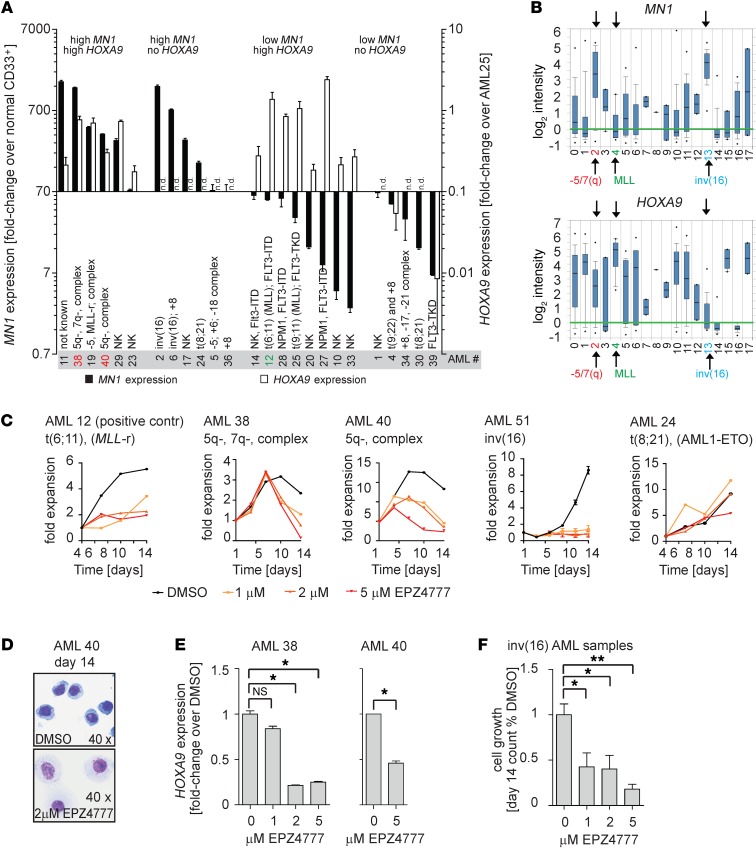
Figure 8. HOXA9 expression and sensitivity to DOT1L inhibition in MN1hi AML patient samples.
(A) qPCR analysis of MN1 (left axis) and HOXA9 (right axis) in 25 primary patient AML samples. MN1 expression values are shown as fold-enrichment compared with normal CD33+ myeloid progenitors and plotted dichotomized at the median (median = 70-fold overexpression). HOXA9 values are plotted as fold-enrichment compared with AML25 (MLL-rearranged, with known high HOXA9 expression set to 1). Error bars represent ±SEM of 2–3 technical replicates. n.d., not detected. (B) MN1 and HOXA9 expression by genotype in Wouters Leukemia data set (Oncomine). Full legend: 0, not determined (90); 1, +8 (20); 2, -5/7(Q) (29); 3, -9q (6); 4, 11q23 (10); 5, complex (13); 6, failure (12); 7, MDS -7(Q) (2); 8, MDS -Y (1); 9, MDS complex (3); 10, normal (187); 11, other (53); 12, abn(3q) (2); 13, idv(16) (34); 14, t(15;17) (21); 15, t(6;9) (6); 16, t(8;21) (35); 17, t(9;22) (2). n = 526 AML samples. (C–F) Exposure of primary patient AML samples to the DOT1L inhibitor EPZ004777 at the indicated concentrations. AML12 (MLL-rearranged [MLL-r], positive control), AML38 (high MN1/HOXA9, complex karyotype with 5q-/7q-), AML 40 (high MN1/HOXA9, complex karyotype with 5q-), AML51 (inv[16], high MN1/no HOXA9), and AML24 (AML/ETO, intermediate high MN1/no HOXA9). Shown are fold-expansion over a 14-day culture period (serial cell counts and Trypan Blue staining; error bars represent duplicate counts) (C). Wright-Giemsa stain on cytospin of AML 40 (high MN1/HOXA9, complex karyotype with 5q-) treated with DMSO or EPZ004777 (D). HOXA9 expression in AML 38 and 40 (high MN1/HOXA9) treated with DMSO or EPZ004777. Error bars over technical replicates; *P < 0.05 (two-sided t test) (E). Summary of cell growth of 3 inv(16) AML patient samples treated with DMSO or EPZ004777 (F). n = 3; *P < 0.05 (two-sided t test).

