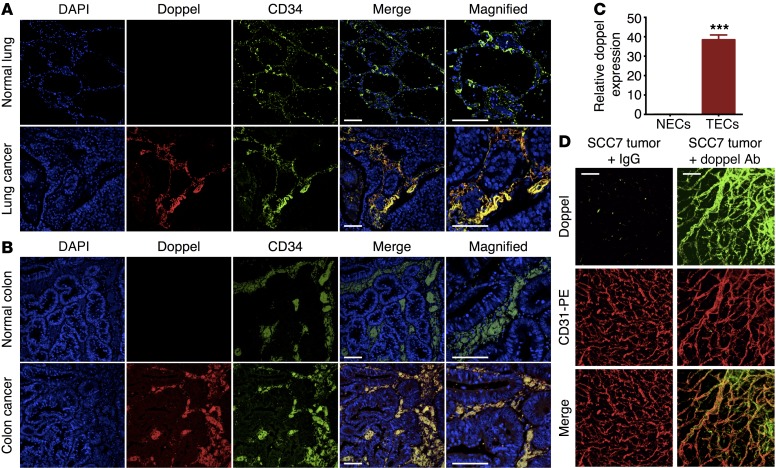
Figure 1. Expression of doppel in clinical and preclinical cancer tissues.
Representative images of lung (A) and colon (B) tissues showing doppel (red), blood vessels (green; CD34), and nuclei (blue). Doppel colocalized with the blood vessels of cancer tissues, but not in normal tissues. Scale bars: 10 μm (merge images) and 20 μm (magnified images). n = 3–5 tissues per group. (C) Relative mRNA expression levels of doppel in mouse NECs derived from brain tissue and TECs derived from SCC7 tumor (data represent 3 experiments). ***P < 0.001 versus NECs, Student’s t test. (D) Whole-mount staining of SCC7 tumor section showing doppel expression (green) in tumor vessels (CD31). Note that incubation of control IgG failed to detect doppel in blood vessels of the tumor, confirming the specificity of the Ab and the accuracy of doppel detection. Scale bars: 50 μm. n = 5 tumors.

