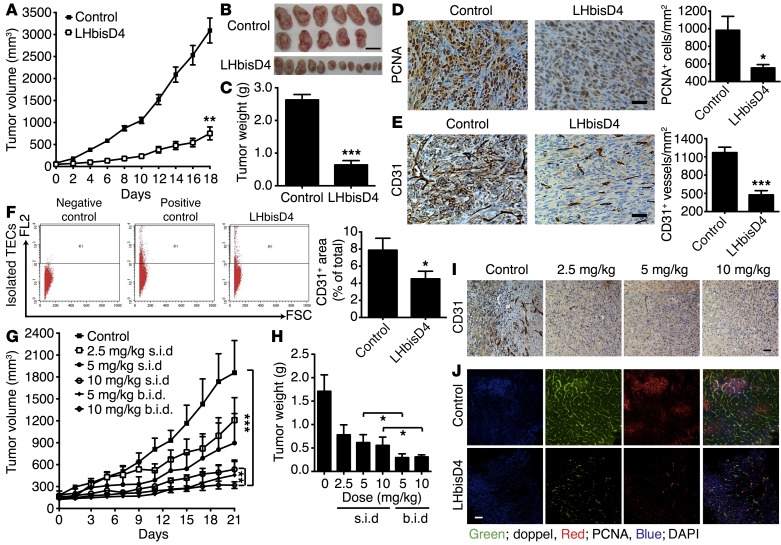
Figure 10. Therapeutic efficacy of LHbisD4.
(A) Orally administered LHbisD4, at a dose of 10 mg/kg daily, inhibited SCC7 tumor growth (n = 11–12 mice). **P < 0.01 versus control, Student’s t test. (B) Images of isolated tumors after termination of the experiment. Scale bar: 1 mm. (C) Tumors were excised after the study to calculate the final tumor weight. ***P < 0.001 versus control. (D and E) Representative images of SCC7 tumor–bearing mouse tumor sections stained for PCNA (proliferating cells) and CD31 (blood vessels) and their staining score (n = 11 mice). Scale bars: 50 μm. *P < 0.05 versus control; ***P < 0.001 versus control, Student’s t test. (F) Total volume of isolated TECs after termination of the experiment (n = 11 tumor sections). *P < 0.01 versus control, Student’s t test. (G) Tumor growth inhibition study of orally administered LHbisD4 in MDAMB-231 tumor at doses of 2.5, 5, and 10 mg/kg once daily or 5 and 10 mg/kg twice daily (n = 5–7 mice). ***P < 0.001 between each of the groups and the control group. **P < 0.01 between the 10 mg/kg once daily and the 10 mg/kg twice daily groups, Mann-Whitney U test. (H) Tumors were excised at the end of the study to calculate the final tumor weight. *P < 0.05, Mann-Whitney U test. (I) Tumor sections from MDAMB-231 tumor–bearing mice were stained for CD31 (blood vessels) after LHbisD4 treatment at different doses (n = 5–7 mice). Scale bar: 50 μm. (J) Dual staining of doppel (green) and PCNA (red) in a section of control and LHbisD4-treated samples. Scale bar: 50 μm.

