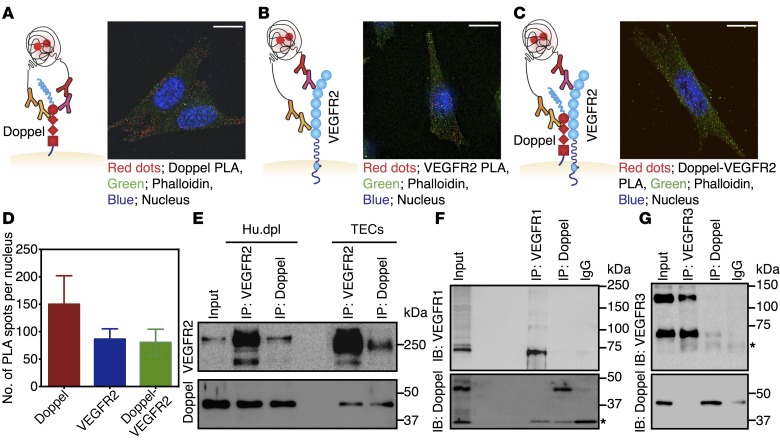
Figure 4. Doppel interacts with VEGFR2 on TECs.
Representative images of the PLA of doppel (A), VEGFR2 (B), and doppel-VEGFR2 interactions (C) identified on TECs. PLA signals are shown with red dots, cytoskeletal staining (FITC-phalloidin) is shown in green, and nuclear staining (DAPI) is shown in blue. Scale bars: 5 μm (A–C). (D) Quantification of doppel, VEGFR2, and doppel-VEGFR2 heterodimer PLA signals in TECs. Co-IP followed by immunoblotting (IB) of VEGFR2 and doppel in Hu.dpl cells and TECs (E), immunoblot of VEGFR1 and doppel (F), and immunoblot of VEGFR3 and doppel (G) in Hu.dpl cells. Input: whole-cell lysates. Single asterisk indicates a light or heavy chain. Each experiment was repeated 3–5 times.

