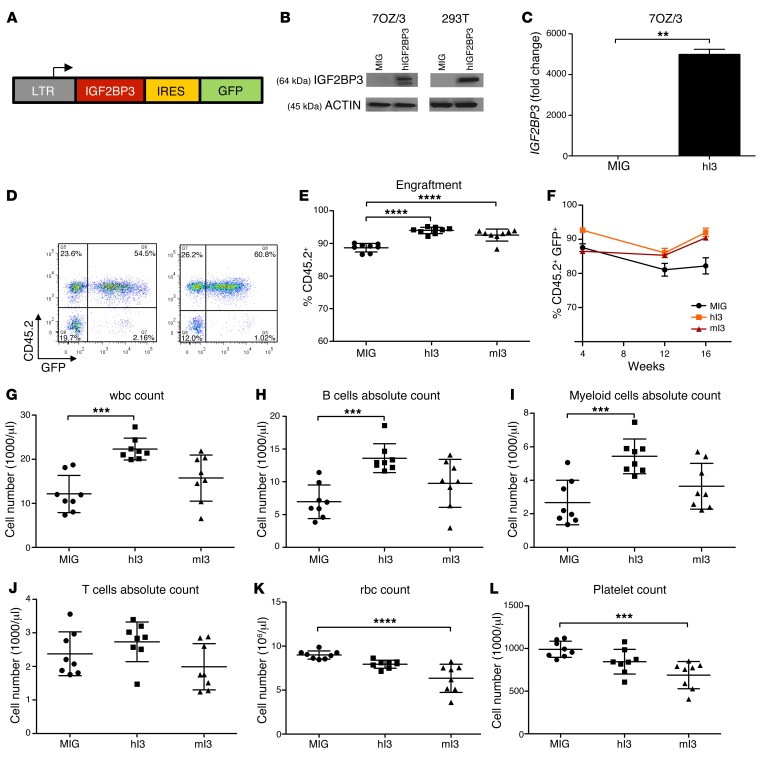
Figure 3. Enforced expression of IGF2BP3 leads to enhanced engraftment and skewing toward B cell/myeloid development.
(A) Schematic of the bicistronic vector used for enforced expression of IGF2BP3. (B) Western blot showing overexpression of IGF2BP3 in the murine pre–B cell line, 7OZ/3, and the human embryonic kidney cell line, 293T. (C) qPCR showing overexpression in 7OZ/3 at the mRNA level (t test; **P = 0.0013). (D) FACS analysis of PB from mice 6 weeks after BMT showing successful engraftment and transduction (GFP+). (E) FACS of PB done at 4 weeks after BMT, showing CD45.2 and GFP positivity (one-way ANOVA followed by Bonferroni’s test; ****P < 0.0001). (F) Quantitation of GFP expression in the PB between 4 and 16 weeks after transplant shows that the effect is marked and sustained. (G) PB leukocyte counts at 16 weeks show increased leukocytes (one-way ANOVA with Bonferroni’s test; ***P < 0.001). (H and I) Significantly higher numbers of B220+ cells (H) and CD11b+ cells (I) in PB (one-way ANOVA with Bonferroni’s test; ***P < 0.001). (J) FACS-based enumeration of T cells shows no significant change in circulating T cells. (K and L) Enumeration of RBCs and platelets by CBC show significant reductions (one-way ANOVA with Bonferroni’s test; ***P < 0.001, ****P < 0.0001). n = 8 for all 3 groups. PB, peripheral blood; BMT, BM transplantation; hI3, human IGF2BP3; mI3, murine IGF2BP3; CBC, complete blood count; LTR, long terminal repeat; IRES, internal ribosome entry site. Three separate BMT experiments were completed for validation. Data represent mean ±SD.

