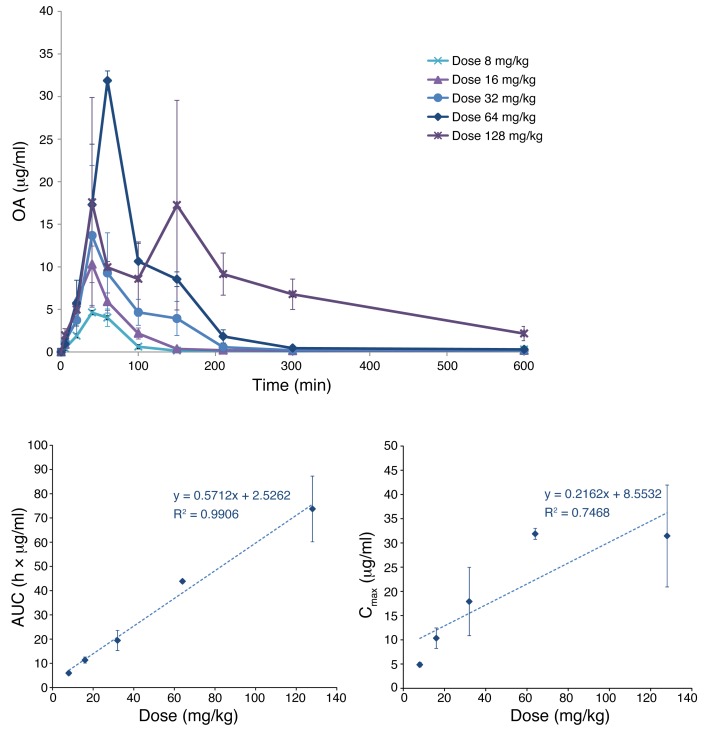
Figure 2. Concentration -time profiles and dose exposure relationships for OA as obtained in the present study.
Concentration-time profile for OA following 5 different oral doses (top). Corresponding dose-exposure relationships showing AUC and Cmax as a function of the administered dose (bottom). Data are shown as mean ± SEM for 3 subjects at each of the 5 dose levels.

