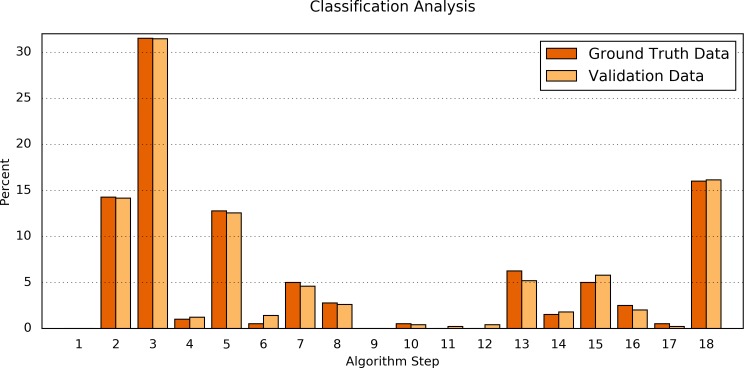
Figure 4. Comparison of the algorithm steps that yield an assessment result.
Plotted are the relative (%) numbers of curves in relation to the algorithm step in which they were classified for the Ground Truth data (orange) and the validation data (light orange). Note that the first step (“Preprocessing”) is disabled by default.

