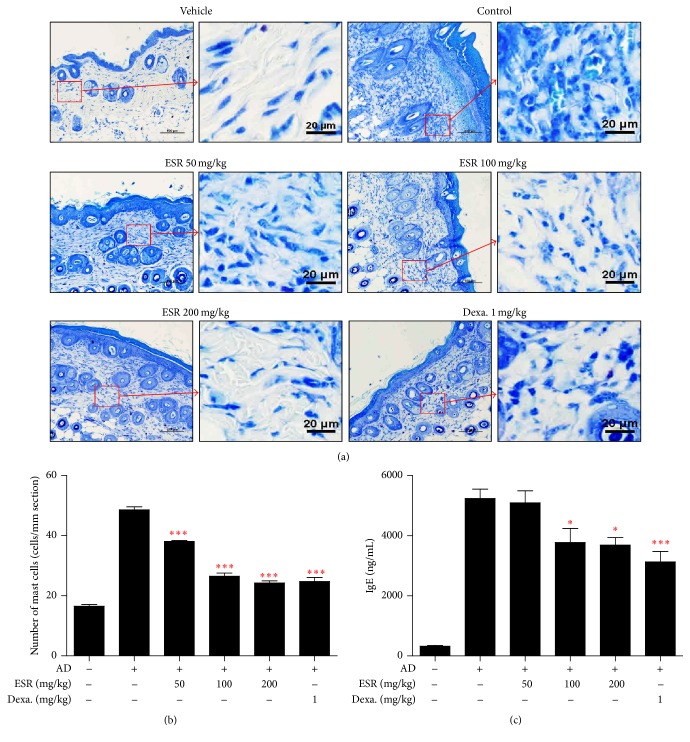
Figure 4.
Effects of ESR on mast cell infiltration and serum IgE level in DNCB-induced AD mouse lesions. (a) Toluidine blue stained AD mouse skin lesions (20x, scale bar = 100 μm) and image of amplification sections (right image of group, scale bar = 20 μm). (b) Number of mast cells per mm section. Mast cell infiltration in toluidine blue stained sections is expressed as the average total count in five fields of 100 μm2. ∗ p < 0.05, ∗∗∗ p < 0.001 versus control.

