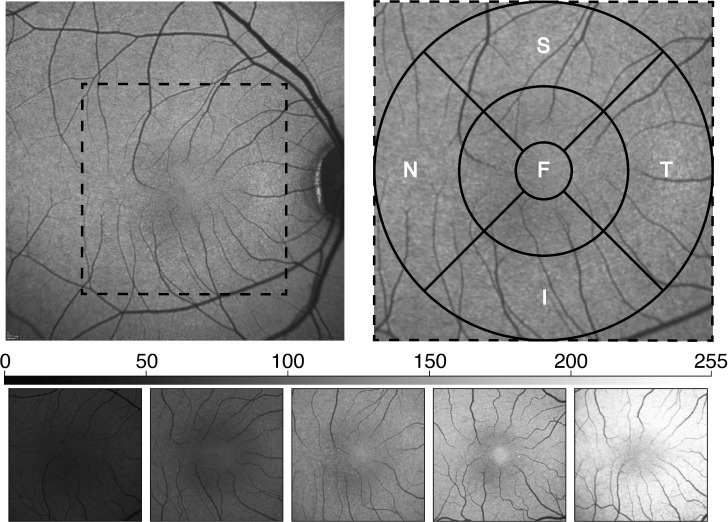
Figure 1.
Methodology of image segmenting and representative images covering the range of MGV observed. Upper left: The acquired image, obtained from the average of 100 nonnormalized scans, is cropped to a 6-mm square centered on the fovea (dotted square). Upper right: The cropped images then were segmented into 9 ROIs by first centering 1 mm (fovea), 3 mm (parafovea), and 6 mm (perifovea) diameter circles on the foveal center. The para- and perifoveal annuli then were further divided into S, N, T, and I quadrants. Bottom: FAF images from animals representing the range of observed MGV values (∼50 to ∼230) averaged over the total segmented area.

