
Figure 2.
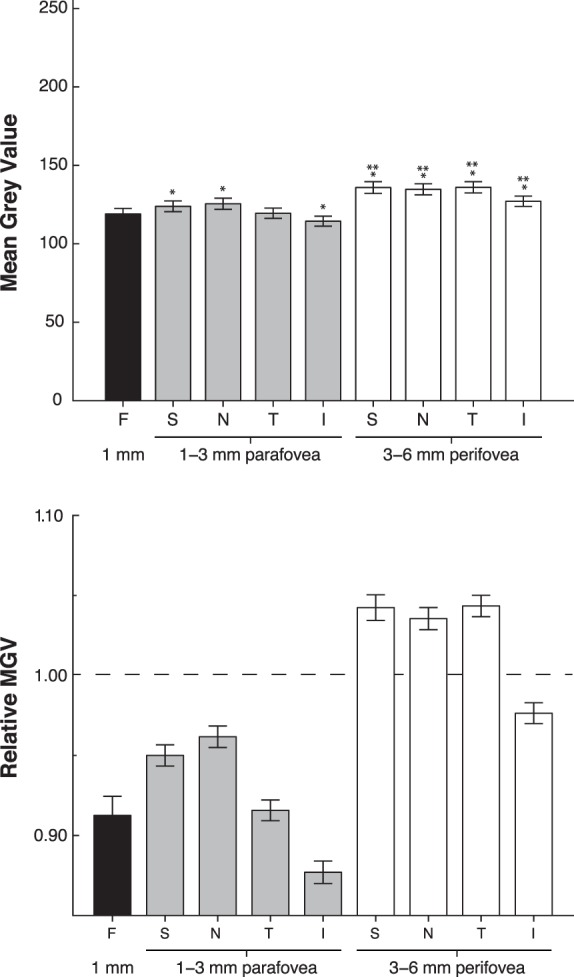
Mean gray values derived from FAF images of standard diet control animals (mean ± SEM, n = 67). *Statistical significance between ROI and fovea. **Statistical significance between the para- and perifoveal annuli within the same quadrant. Top: When divided into all 9 ROIs, the S, N, and I regions of the parafovea were brighter than the fovea, and all four perifoveal quadrants were brighter than the fovea. In addition, all four perifoveal quadrants were significantly brighter than the corresponding parafoveal region. Lower: Relative MGV illustrating the regional differences in FAF. For calculation of relative MGV, the weighted average of each ROI was divided by the average MGV of the total area. The dotted line represents the average FAF of the total segmented area.