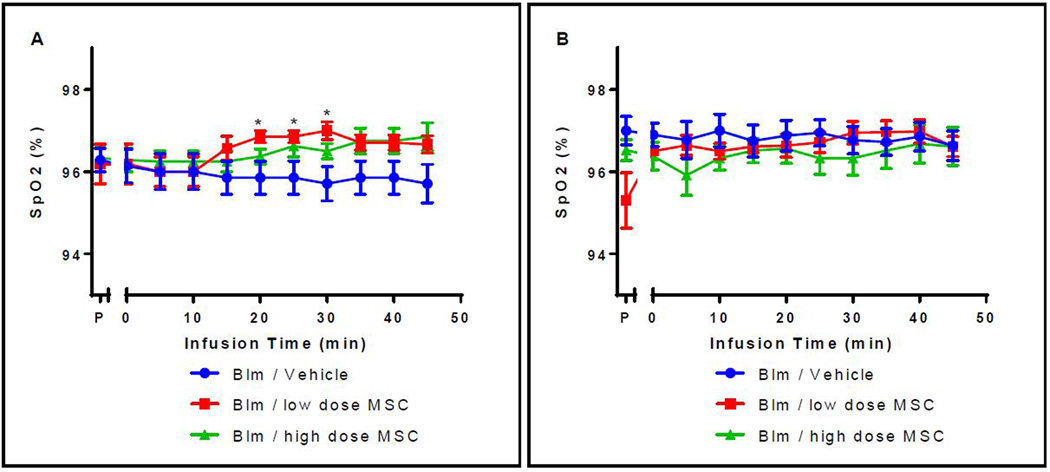
Figure 5. Change in SpO2 values during the first (A) and second (B) intravenous infusion.
(A) After 20, 25, and 30 minutes there was a significant difference in saturated blood oxygen levels between the Blm/low MSC dose and the Blm/vehicle control groups (p=0.038, 0.038, 0.019 respectively). No other significant differences were detected between other time points or groups. P = pre-bleomycin instillation; Group 1- Blm/Vehicle Control; Group 2- Blm/low dose MSC; Group 3- Blm/high dose MSC. (B) After the second intravenous infusion, there were no significant differences in saturated blood oxygen levels either within groups or between groups at any of the time points evaluated. P = pre-bleomycin instillation; Group 1- Blm/Vehicle Control; Group 2- Blm/low dose MSC; Group 3- Blm/high dose MSC.

