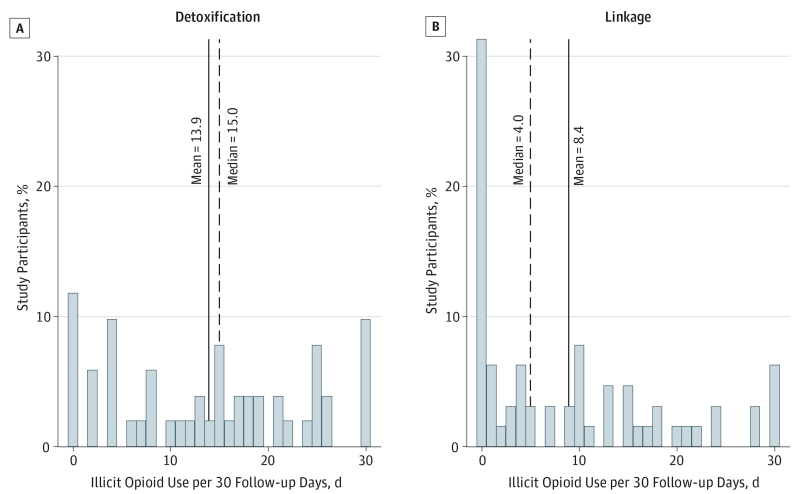
Figure 2.
Distribution of Rates of Illicit Opioid Use During Follow-up Assessment by Intervention in 116 Individuals
A, Detoxification group; B, linkage group. To facilitate description, rates were calculated as days of illicit opioid use per 30 follow-up days using all available data, including the mean of all assessments for each study participant with multiple follow-up data or any follow-up time point for participants with one time point.

