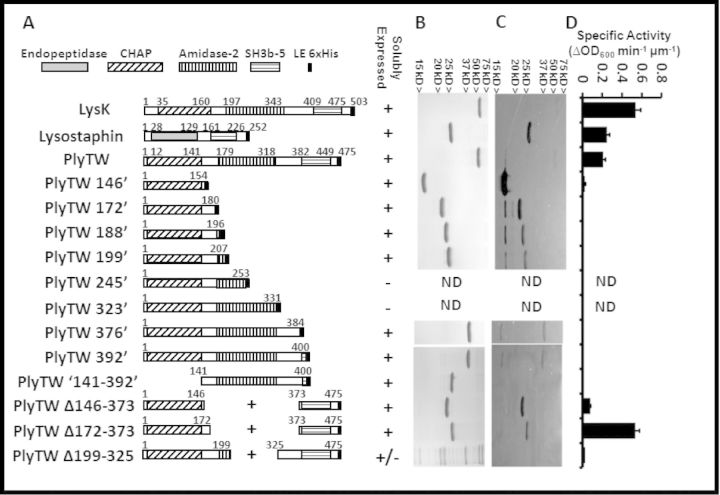
Figure 1.
Schematic representation, SDS-PAGE and zymogram analysis of PlyTW constructs. (A) Full length lysostaphin, LysK, PlyTW endolysin and PlyTW deletion constructs are schematically represented with domains labeled as identified in the Pfam domain database (http://pfam.sanger.ac.uk/protein?entry=O56788). Fusion junction points are noted. Endopeptidase domain (solid gray), CHAP domain (diagonal stripes), amidase domain (vertical stripes), SH3b domain (horizontal stripes) and the 6xHis tag (black box) are represented. At each fusion junction, and 6xHis tag, there is an XhoI restriction enzyme site introduced (corresponding to an LE sequence in the amino acid sequence). Endolysin sequences and SH3b sequences are drawn to scale. His tags are not drawn to scale. (B) SDS-PAGE analysis and (C) Zymogram analysis of 1 μg nickel column purified proteins corresponding to the constructs in panel A. (D) Turbidity reduction analysis of expressed proteins. Specific activities (ΔOD600nm μm−1 min−1) for the PlyTW constructs are presented as the maximal change in OD600nm (during a 40 s interval, i.e. three time points) over the 30 min assay. Each data point [± standard deviation (SD)] represents samples at 0.5 μM protein, in 150 mM NaCl SLB from at least two experiments performed in triplicate (n ≥ 6).

