Figure 1.
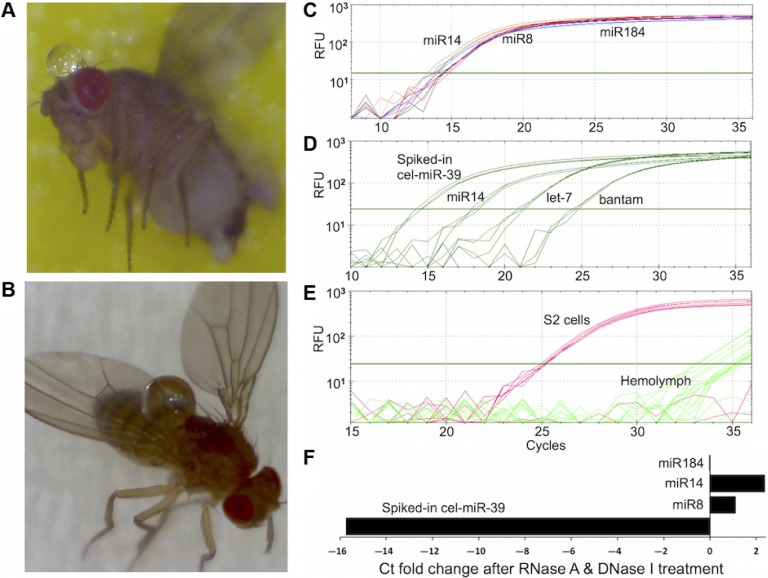
Presence of stable miRNAs in Drosophila melanogaster hemolymph. (A, B) Clear HL droplets extruded from fly head and thorax. (C–F) Real-time qPCR amplification of selected HL miRNAs and mRNAs. Total RNA including small RNA was extracted from HL samples and analyzed with qPCR to measure the levels of miRNAs and mRNAs. The y-axis represents the relative fluorescence units (RFU) in a semi-log scale. The x-axis represents the cycle at which fluorescence was detected above an automatically determined threshold. (C) Amplification plots for miR-14, miR-8, and miR-184 measured in a representative HL sample. (D) Amplification plots for miR-14, let-7, bantam, and spiked-in synthetic C. elegans cel-miR-39 RNA in representative HL sample. (E) The amplification plots for tubulin, actin, and gapdh mRNAs determined by qPCR using total RNA from HL and S2 cells. Sample from S2 cells are used as a positive control for detecting Drosophila mRNAs by qPCR. The amplification curves of all three mRNAs are superimposed on one another, reflecting the presence of similar amounts of these mRNA in S2 cells. Amplification curves from HL samples show that fluorescent products appear after about 30 cycles, reflecting the significantly lower abundance of these mRNAs in HL relative to S2 cells. (F) The cycle threshold (Ct) fold-change of selected miRNA amplified in the absence or presence of RNase A and DNase I. Total RNA was extracted from HL samples spiked with 10 fmoles of cel-miR-39 RNA. The x-axis represents the ratio of raw Ct values from control samples divided by raw Ct values from samples incubated with RNase A and DNase I. The significantly higher magnitude of the Ct fold change of the spiked-in synthetic miRNA relative to those of the miRNA indicates that the HL-miRNA are present in nuclease-resistant, stable form.

