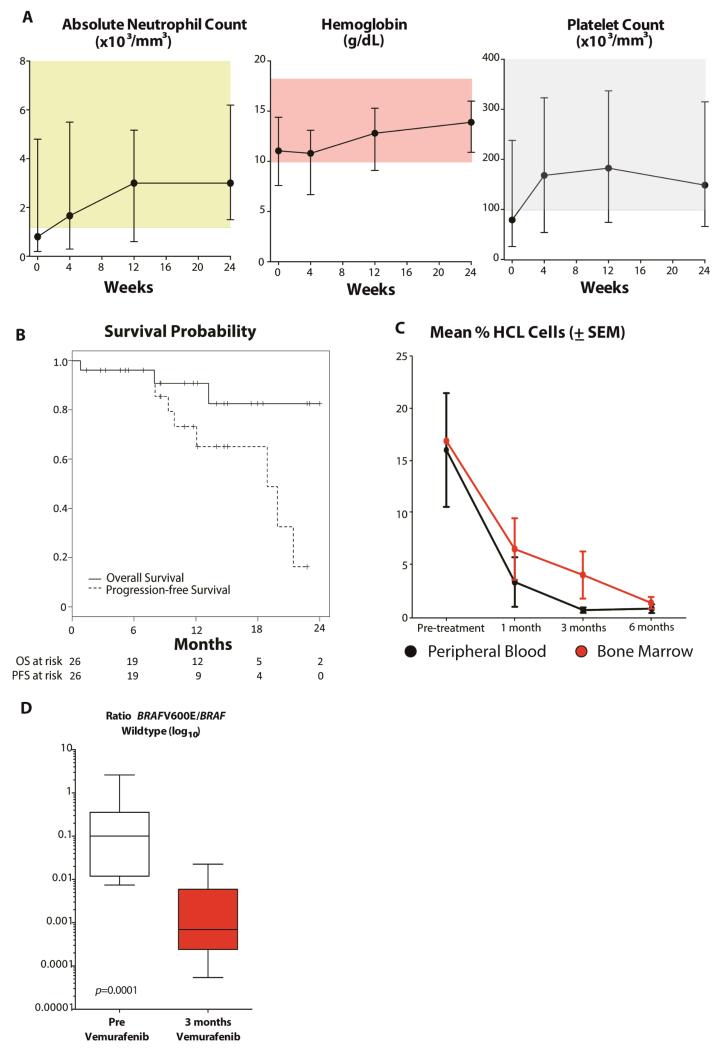
Figure 2. Effect of vemurafenib on peripheral blood counts, survival, flow cytometric enumeration of hairy cells, and BRAFV600E allele burden.
(A) Median value of the absolute neutrophil count, hemoglobin and platelet cell counts of the 24 evaluable patients over time after initiating vemurafenib treatment. Error bars denote the upper and lower limits. (B) The probability of progression-free survival and overall survival for all 26 patients. Tick marks indicate censored data. (C) Mean percentage of HCL cells in peripheral blood and bone marrow mononuclear cells over time of patients from this study (± standard error of mean (SEM)). Mean percentage of HCL cells decreased with each period of vemurafenib therapy shown (p<0.05 comparing percentage of HCL cells for each time point on therapy relative to pretreatment values). (D) Ratio of the concentration of BRAFV600E:BRAF wildtype alleles (log10) in DNA from peripheral blood mononuclear cells pretreatment with vemurafenib and following 3 months of vemurafenib. The ratios are displayed as box-and-whisker plots with the median value as the middle bar, the ends of the boxes as upper and lower quartile values, and ends of whiskers as highest and lowest values.

