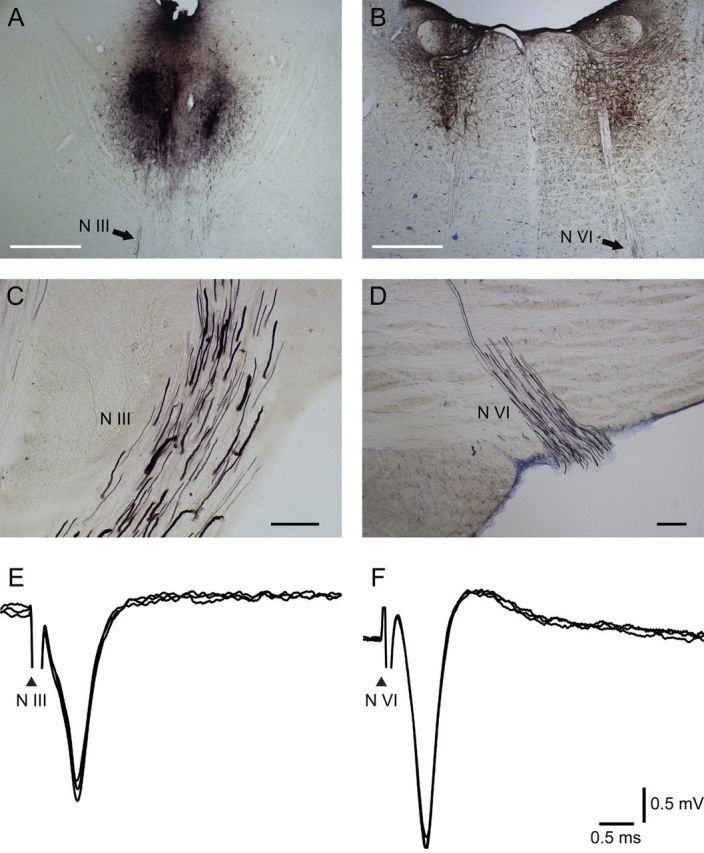
Figure 2.

BDA tracer injections and labeling in the brainstem. The tracer was visualized with the DAB reaction and enhanced with ammonium sulfate, and so it appears in black. A, B, Image of the injection site in the oculomotor nucleus (A) and in the abducens nucleus (B). Scale bars, 1 mm. C, D, Rootlets of the oculomotor nerve (N III) (C) and the abducens nerve (N VI) (D) show axons anterogradely labeled with BDA. Scale bars, 100 μm. E, F, Antidromic field potentials obtained after single pulse electrical stimulation applied to the IIIrd (E) and VIth (F) nerves, respectively. Arrowhead denotes the stimulus artifact produced by the electrical stimulation to the corresponding nerve.
