Figure 1. Bidirectional endocannabinoid-mediated STDP depends on the number of pairings.
(A) Whole-cell recording from the dorsal striatum with the stimulation electrode placed in layer 5 of the somatosensory cortex in horizontal rat brain slice. (B) Experimental design. Extracellular stimulation evoked EPSCs monitored at RMP. During pairings, recordings were switched to current-clamp to allow postsynaptic MSN to fire single action potentials paired with single cortical extracellular stimulations. MSN and cortical stimulation were repeated N times (10 or 100) at 1 Hz. ΔtSTDP indicates the time delay between pre- and post-synaptic stimulations. -30<ΔtSTDP<0 ms and 0<ΔtSTDP<+30 ms refers to post-pre and pre-post pairings, respectively. (C) 100 post-pre pairings induced NMDAR-mediated tLTP. (C1) Example of tLTP induced by 100 post-pre pairings. Top, EPSC strength before and after pairings (before pairings: 91±3 pA; 45–55 min after pairings: 169±2 pA; increase of 87%). Bottom, time courses of Ri (before, 132±1 MΩ; after, 134±2 MΩ; change of 2%) and injected current (Iinj) (before, -2±1 pA; after, -12±2 pA; change of 6% of baseline EPSC amplitude) for this cell. (C2) Summary of tLTP induced by 100 post-pre pairings. 15/19 cells showed significant tLTP. Inhibition of NMDAR with D-AP5 (50 μM, n=4) prevented the induction of tLTP; 4/4 cells showed no significant plasticity. The normality of D-AP5 data was assumed (test not passed). (D) 100 pre-post pairings induced CB1R-mediated tLTD. (D1) Example of tLTD induced by 100 pre-post pairings. Top, EPSC strength before and after pairings (before pairings: 134±2 pA; 45–55 min after pairings: 82±2 pA; decrease of 39%). Bottom, time courses of Ri (before, 156±2 MΩ; after, 157±1 MΩ; change of 1%) and injected current (Iinj) (before, 14±1 pA; after, 20±1 pA; change of 5%) for this cell. (D2) Summary of tLTD induced by 100 post-pre pairings. 7/11 cells showed significant tLTD. Inhibition of CB1R with AM251 (3 μM, n=4) prevented the induction of tLTD; 4/4 cells showed no significant plasticity. The normality of AM251data was assumed (test not passed). (E) 10 post-pre pairings induced CB1R-mediated tLTP. (E1) Example of tLTP induced by 10 post-pre pairings. Top, EPSC strength before and after pairings (before pairings: 112±4 pA; 45–55 min after pairings: 213±4 pA; increase of 90%). Bottom, time courses of Ri (before, 171±2 MΩ; after, 167±1 MΩ; change of 2%) and injected current (Iinj) (before, 10±1 pA; after, 12±1 pA; change of 2%) for this cell. (E2) Summary of tLTP induced by 10 post-pre pairings. 21/25 cells showed significant tLTP. Inhibition of CB1R with AM251 (3 μM, n=5) prevented the induction of tLTP; 5/5 cells showed no significant plasticity. Normality was assumed for the ctrl 10x post-pre data (test not passed). (F-H) eCB-LTP is maintained by a mechanism located downstream of CB1R activation in the presynaptic terminals. (F) Representative EPSCs and summary bar graphs (n=14) of paired-pulse cortical stimulations (50 ms interstimulus interval) illustrate a decrease of facilitation after 10 post-pre pairings. This indicates a presynaptic locus of the eCB-tLTP. (G) Mean variance analysis (CV-2, n=17) indicates a presynaptic locus of the eCB-tLTP maintenance. (H) Summary of tLTP induced by 10 post-pre pairings with application of CB1R inhibitor just after the pairings (AM251*) (7/8 cells showed significant tLTP). This treatment did not prevent tLTP, indicating that the maintenance of eCB-tLTP does rely on the signaling downstream of CB1R. Normality was assumed for the data og CV-2 after STDP protocol (test not passed). Representative traces are the average of 15 EPSCs during baseline (black traces) and 50 min after STDP protocol (grey traces). Error bars represent s.d. *p<0.05. ns: not significant.

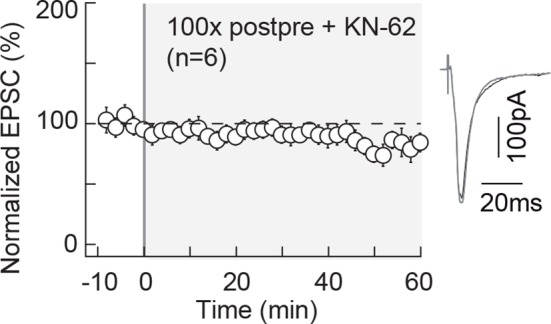
Figure 1—figure supplement 1. NMDAR-tLTP relies on CaMKII activity.