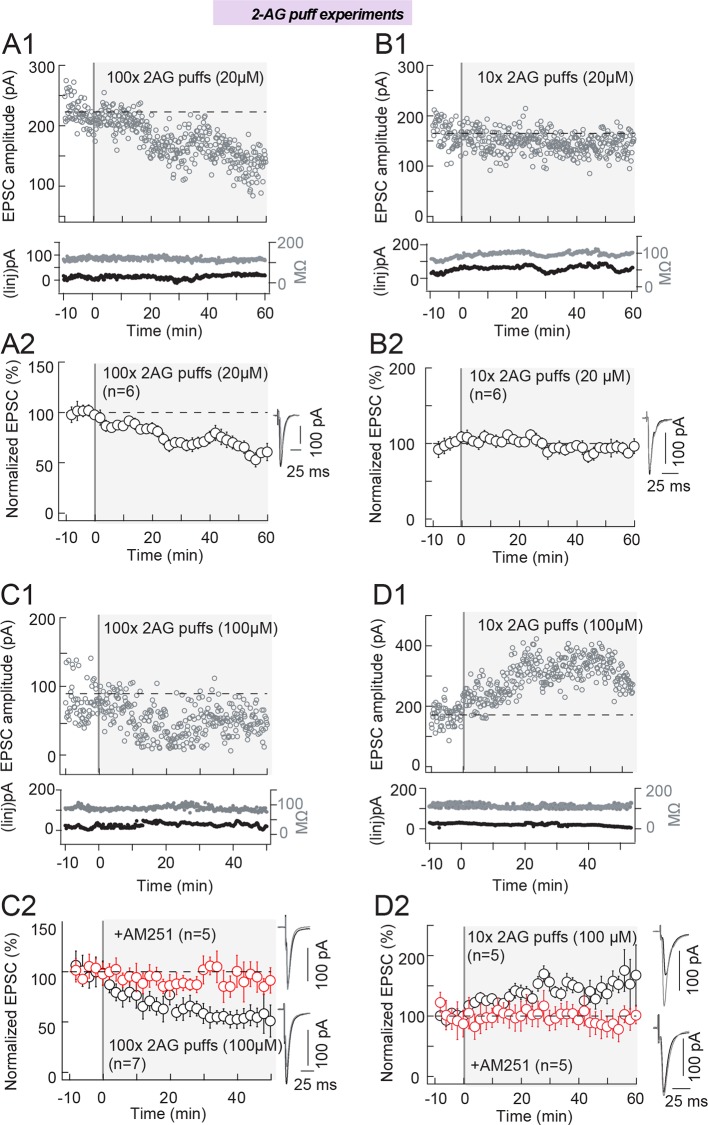
Figure 6. 2-AG level and duration control the eCB-plasticity polarity.
(A) Repeated (100 times) brief application of 2-AG (at a low concentration, 20 μM) induces LTD. A series of 100 2-AG puffs (20 μM, 300 ms duration each) delivered at 1 Hz at the vicinity (50–100 μm) of the recorded striatal neuron, induced LTD in the absence of any STDP protocol (n=6). (A1) Example of LTD induced with 100 puffs of 20 μM 2-AG. Top, EPSC strength before and after 2-AG puffs (before 2-AG puffs: 223±3 pA; 45–55 min after 2-AG puffs: 144±3 pA; decrease of 35%). Bottom, time courses of Ri (before, 118±1 MΩ; after, 111±1 MΩ; change of 6.2%) and injected current (Iinj) for this cell. (A2) Summary of LTD induced with 100 puffs of 20 μM 2-AG; 6/6 cells showed significant LTD. (B) Repeated (10 times) brief application of 2-AG (at a low concentration, 20 μM) failed to induce plasticity. (B1) Example of absence of plasticity observed with 10 puffs of 20 μM 2-AG. Top, EPSC strength before and after 2-AG puffs (before 2-AG puffs: 165±3 pA; 45–55 min after 2-AG puffs: 143±2pA; change of 14%). Bottom, time courses of Ri (before, 82±1MΩ; after, 93±1MΩ; change of 13%) and injected current (Iinj) for this cell. (B2) Summary of absence of plasticity observed with 10 puffs of 20 μM 2-AG; 2/6 cells showed no significant plasticity. (C) Repeated (100 times) brief application of 2-AG (at a high concentration, 100 μM) induces LTD. (C1) Example of LTD induced with 100 puffs of 100 μM 2-AG. Top, EPSC strength before and after 2-AG puffs (before 2-AG puffs: 95±3 pA; 45–55 min after 2-AG puffs: 77±1 pA; decrease of 19%). Bottom, time courses of Ri (before, 92±1 MΩ; after, 78±1 MΩ; change of 15%) and injected current (Iinj; before, 16±1 pA; after, 26±1 pA; change of 12.8%) for this cell. (C2) Summary of LTD induced with 100 puffs of 100 μM 2-AG; 7/7 cells showed significant LTD. This 2-AG-mediated LTD was prevented by AM251 (3 μM, n=5); 5/5 cells showed no significant LTD. (D) Repeated (10 times) brief application of 2-AG (at a high concentration, 100 μM) induces LTP. (D1) Example of LTP induced with 10 puffs of 100 μM 2-AG. Top, EPSC strength before and after 2-AG puffs (before 2-AG puffs: 171±4 pA; 45–55 min after 2-AG puffs: 331±6 pA; increase of 94%). Bottom, time courses of Ri (before, 119±1 MΩ; after, 109±1 MΩ; change of 8.4%) and injected current (Iinj) (before, 26±1 pA; after, 18±1 pA; change of 4.7%) for this cell. (D2) Summary of LTP induced with 10 puffs of 100 μM 2-AG; 4/5 cells showed significant LTP. This 2-AG-mediated LTP was prevented by inhibition of CB1R with AM251 (3 μM, n=5); 5/5 cells showed no significant plasticity. Example recording monitoring EPSCs (at 0.1 Hz) (A1, B1, C1 and D1) before and after 2-AG puffs, together with the time course of Ri and of the injected current (Iinj). Summary (A2, B2, C2 and D2) show global average of experiments with error bars representing s.d. Representative traces are the average of 15 EPSCs during baseline (black traces) and 50 min after STDP protocol (grey traces). *p<0.05. ns: non-significant.

