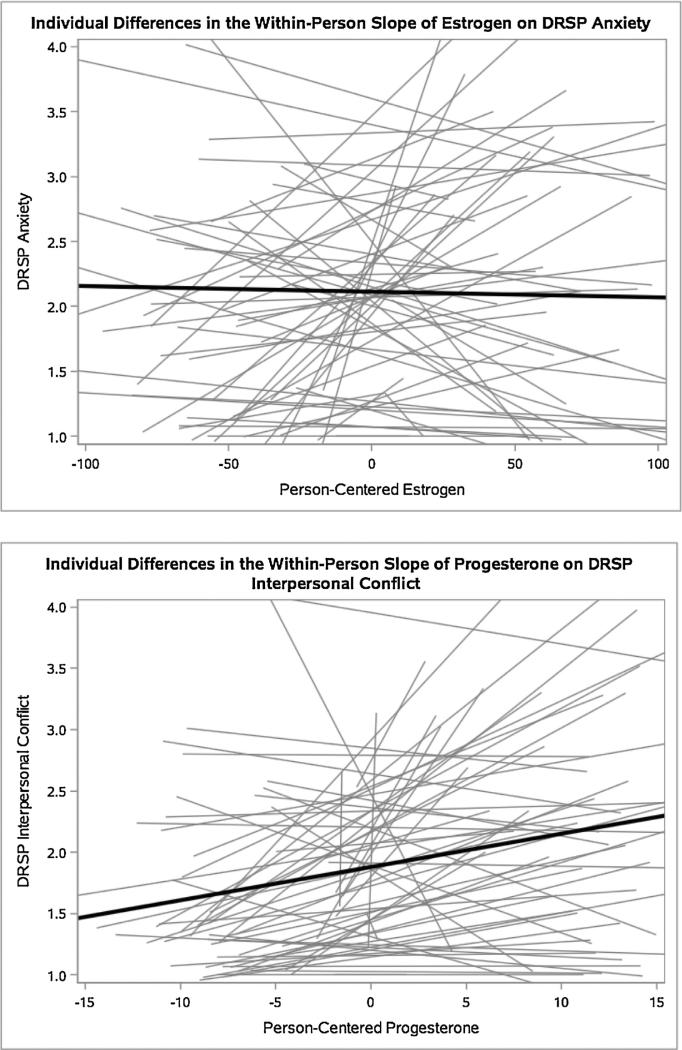
Fig. 1.
Illustrative graphs of individual differences in the slopes of E2 and P4 on symptoms.
Note. Each gray line represents one subject, and the black lines represent mean within-person effects of hormones on symptoms. These graphs are illustrative of large individual differences in hormone-symptom links across all symptoms.

