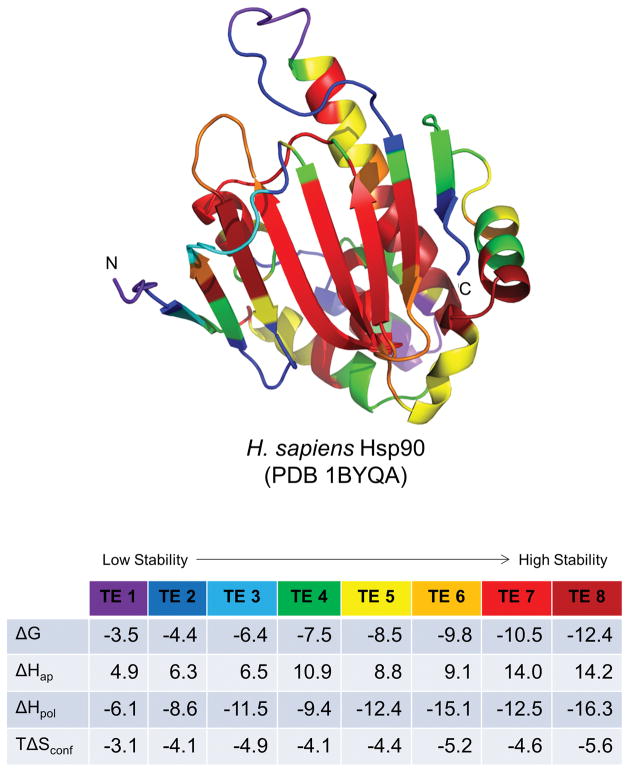
Figure 5. Representation of protein structure in terms of native state ensemble-based thermodynamic environments.
Example protein Hsp90 1BYQ from the thermodynamic environments database (top). Residue cartoon color coding corresponds to the average thermodynamic quantities in the environments table (bottom). Values in the table are in units of kcal/mol under simulated folding conditions: 25 °C, pH = 7.0. Rainbow coloring follows the order of average thermodynamic stability: purple, blue, green exhibit lowest stability (least negative ΔG), yellow, orange, red exhibit highest stability (most negative ΔG). The beta-strand core of this protein contains most (but not all) of the highest stability regions, while some (but not all) of the loops and turns are lower in stability.

