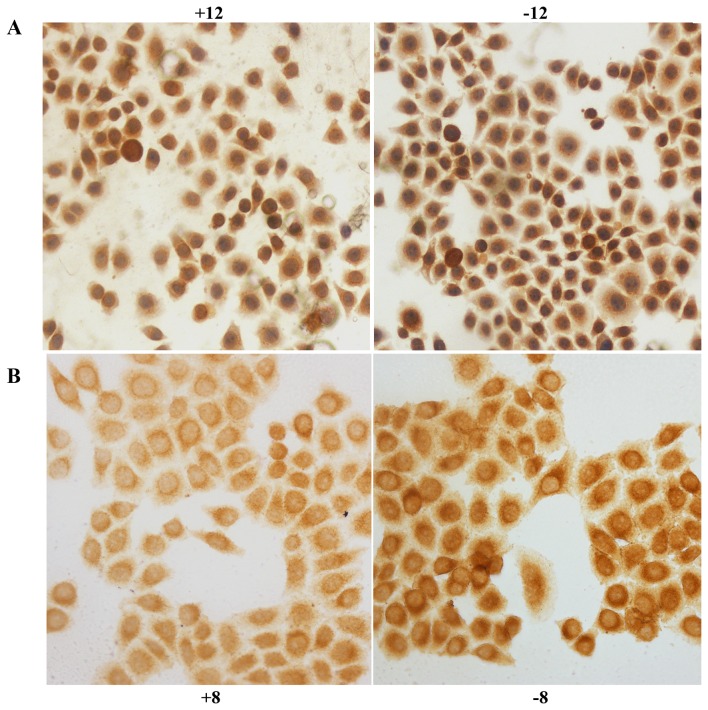
Figure 1.
(A) HIF-1α immunocytochemical staining in the BGC-823 control and experimental cell groups at 12 h; the labels +12 and −12 indicate the experimental group and control group, respectively, at 12 h. (B) ITGβ1 immunocytochemical staining in the control and experimental groups at 8 h; the labels +8 and −8 indicate the experimental group and control group, respectively, at 8 h.

