
Figure 2.

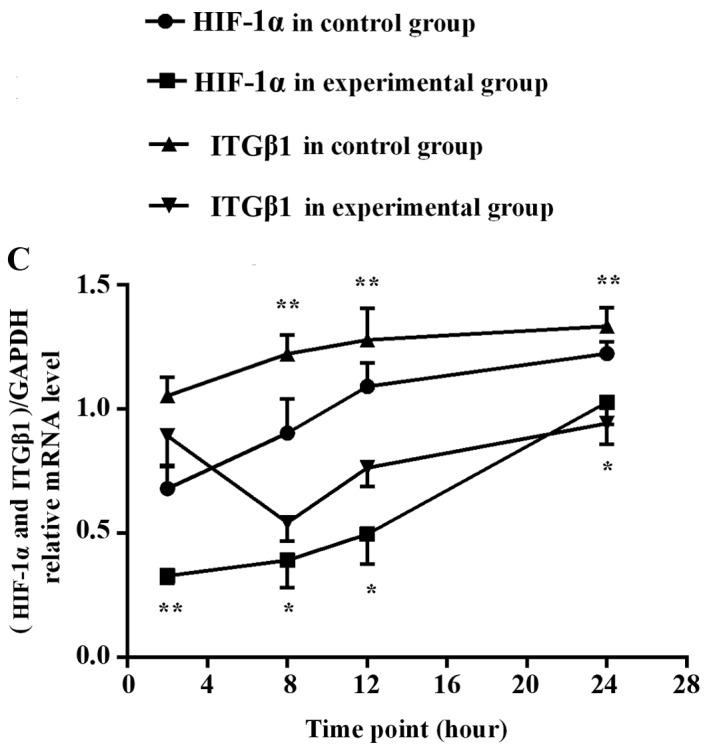
RT-PCR was used to detect HIF-1α (A) and ITGβ1 (B) mRNA expression levels in the experimental group and the control group in vitro. (C) Line graph of the gray values of the relative HIF-1α and ITGβ1 mRNA expression. The labels +2, +8, +12, +24, indicate the experimental group at 2, 8, 12, and 24 h, respectively, and the labels −2, −8, −12, and −24 indicate the control group at 2, 8, 12, and 24 h, respectively. *P<0.05 or **P<0.01, difference between the experimental group and the control group.