
Figure 5.
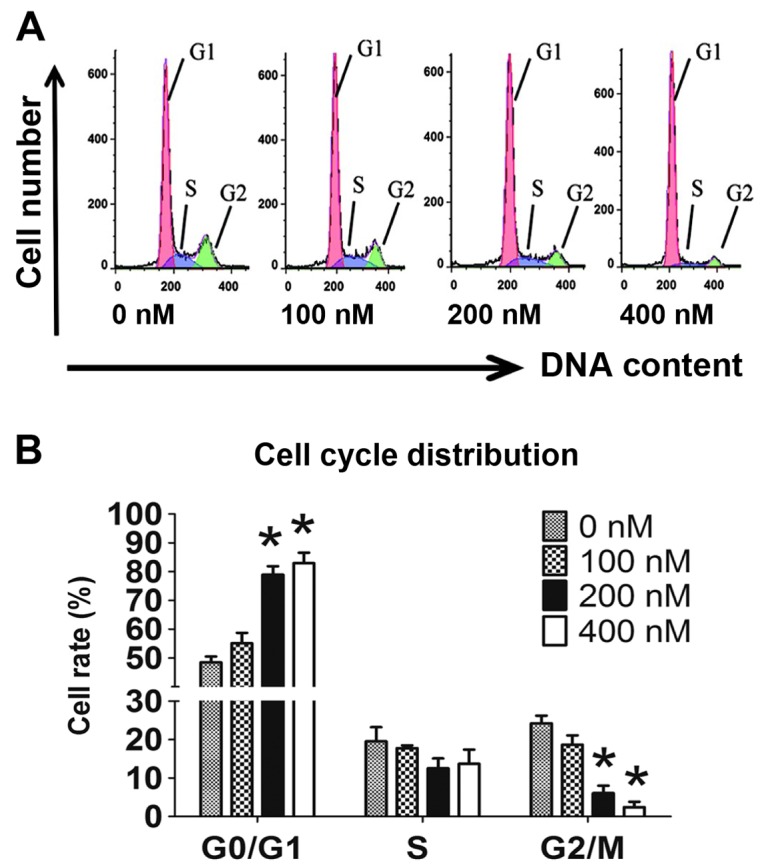
(A and B) Cell cycle distribution of CCLP-1 cells after treatment with HC toxin for 48 h; 0, 100, 200 and 400 nM are the doses of HC toxin used. *P<0.05, difference is statistically significant.
Official websites use .gov
A
.gov website belongs to an official
government organization in the United States.
Secure .gov websites use HTTPS
A lock (
) or https:// means you've safely
connected to the .gov website. Share sensitive
information only on official, secure websites.
(A and B) Cell cycle distribution of CCLP-1 cells after treatment with HC toxin for 48 h; 0, 100, 200 and 400 nM are the doses of HC toxin used. *P<0.05, difference is statistically significant.