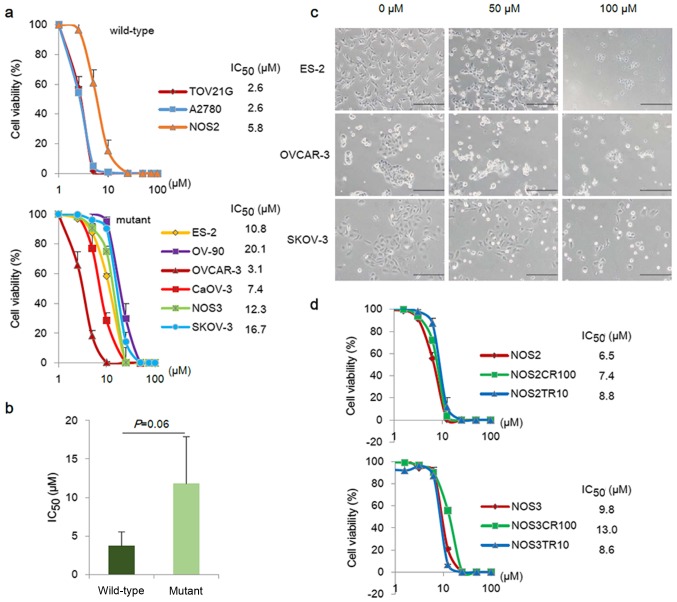
Figure 2.
The effects of PRIMA-1MET on tumor cell growth in ovarian cancer cells. (a) PRIMA-1MET-induced growth suppressive dose response curves of EOC cells following 48 h of PRIMA-1MET treatment. The IC50 values of PRIMA-1MET were determined in a total of 9 EOC cell lines by cell viability assay. Data represent the mean ± standard deviation (SD) from triplicate reactions. (b) Correlation between PRIMA-1MET 48 h IC50 values and TP53 status. EOC cell lines with wild-type p53 were slightly more sensitive than those with mutant p53 (not significant). (c) PRIMA-1MET-induced morphological changes in EOC cells. ES-2, OVCAR-3, and SKOV-3 cells were cultured in a 6-well plate, and then treated with 0, 50, 100 µM PRIMA-1MET for 24 h. PRIMA-1MET-induced morphological changes were observed using microscopy (scale bar, 200 µm). (d) PRIMA-1MET-induced growth suppressive dose response curves of NOS2, NOS3, and their chemo-resistant cells. The IC50 values of 48 h PRIMA-1MET were determined by cell viability assay. Data displays mean ± standard deviation (SD) from triplicate reactions.

