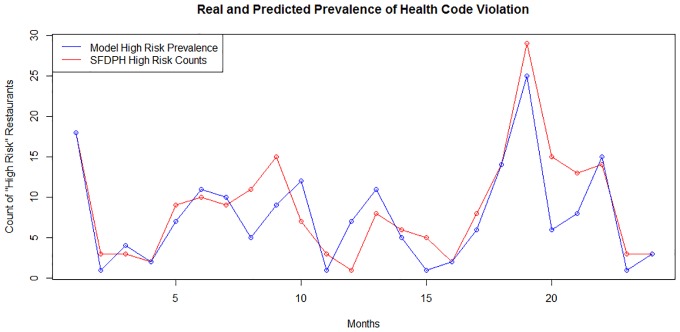
Fig 5. Plot of observed and predicted prevalence of low health code rating over a two year period from the beginning of 2013 to the end of 2014 using validation dataset for first year and for second year.
Blue lines reflect predicted counts and red lines reflect the observed counts of restaurants with health code rating <80 (substandard).

