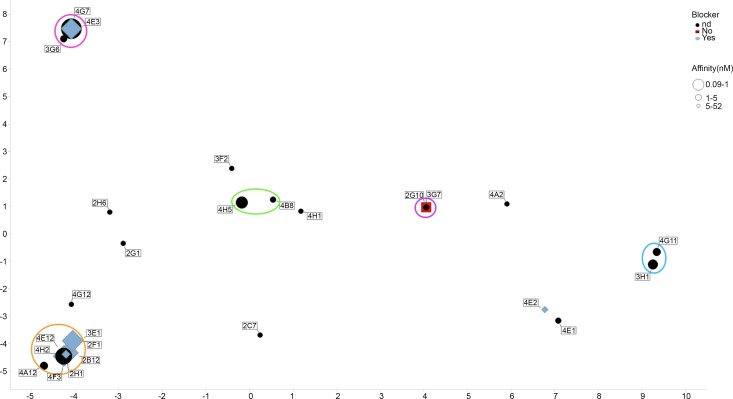
Fig 7. Diversity assessment of mouse anti-human TNFR2 antibodies.
For each antibody, VH CDR3 sequences were aligned in a pairwise manner to generate a sequence distance value. We performed a Principal Components Analysis (PCA)34 as a means to reduce down the dimensionality of this data and generate an easy to interpret 2-dimensional data plot that illustrated the extent of diversity in our recombinant antibody panel. Data for principle component (PC) 1 and 2 are shown on the X and Y axis respectively. Clustering analysis was performed and families of closely related sequences were assigned on the basis of sequence identity in the VH CDR3 regions of 80% or higher. Clusters containing multiple sequences have been circled. All other sequences were considered unique. Identical sequences being co-located on the 2-D plot but indicated with multiple identifier flags. Blue diamonds represent blocking antibodies, red squares represent non-blockers and black circles were antibodies where blocking data could not be reliably generated. The size of the data point markers are indicative of affinity, with large markers representing high affinity (maximum of 90 pM) and smaller markers representing lower affinity (minimum of 52 nM).

