Figure 5. Symptoms and ages.

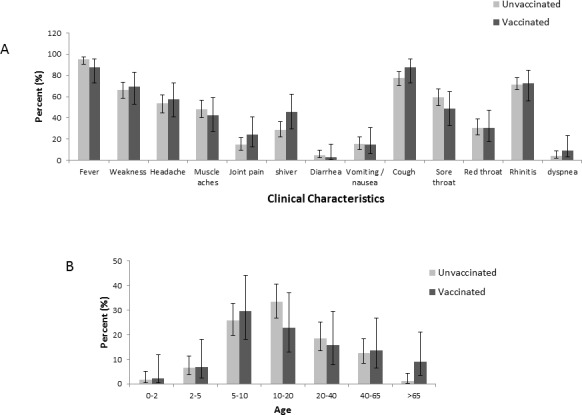
The figure demonstrates the symptoms and signs (A) and age (B) of patients infected with influenza A(H3N2) virus. The total number of patients in each group (vaccinated and non-vaccinated) were set to be 100%.

The figure demonstrates the symptoms and signs (A) and age (B) of patients infected with influenza A(H3N2) virus. The total number of patients in each group (vaccinated and non-vaccinated) were set to be 100%.